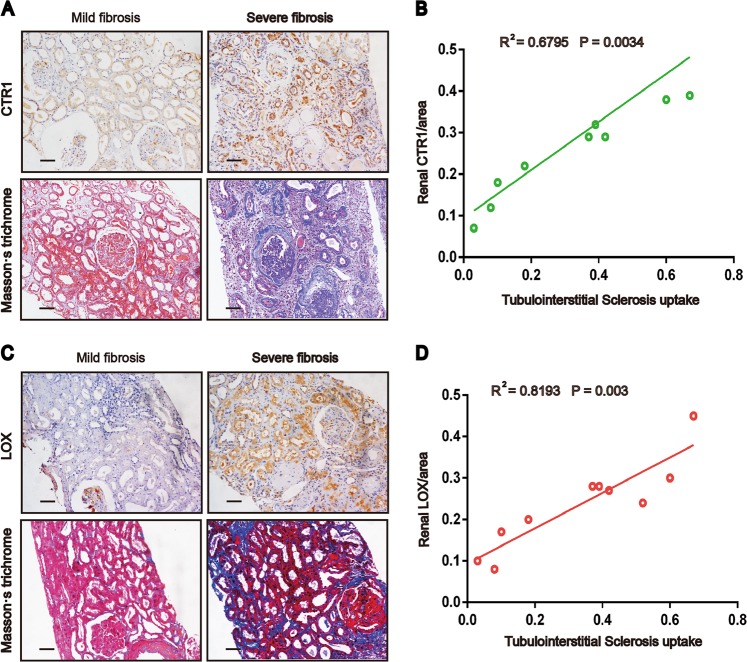
Fig. 6. Renal CTR1 and LOX levels correlate with the severity of renal fibrosis in patients.
a, c IHC staining for CTR1 or LOX and Masson’s staining in kidney sections from 10 renal puncture patients. Original magnification, ×200. Bar = 50 μm. b, d Scatter plots with linear regression showing the correlation between CTR1 expression levels and the extent of renal fibrosis (R2 = 0.6795, P = 0.0034) and the correlation between LOX expression levels and the extent of renal fibrosis (R2 = 0.8193 P = 0.003). The expression of CTR1 and LOX and the level of fibrosis were quantitatively assessed by IHC staining and Masson’s staining, respectively, using a quantitative image-analysis system. Tubulointerstitial fibrosis and LOX and CTR1 expression were quantified based on five randomly selected high-power fields under a microscope equipped with a quantitative image-analysis system (Image-Pro Plus 6.5, Media Cybernetics, Silver Springs, MD), and the results are presented as the percentage of the area with positive staining.

