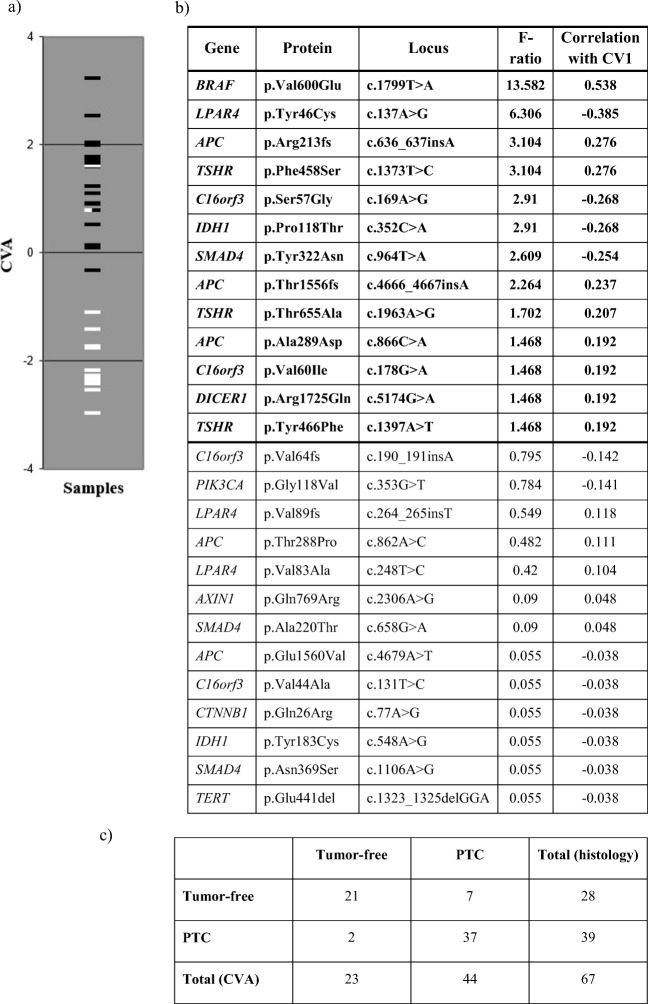
Fig. 1.
The relationship between the actual state of the tumor-free and PTC samples, analysis of the selected 26 variants which occurred more than twice or more times. a Graphical display of samples separated by CVA of the selected 26 variants which were determined more than 2 or more times in our cohort. The benign tumor-free samples are marked with white lines and PTC samples are represented by black lines. b Table is summarizing the calculated F-ratios and the correlations with the single canonical variate (CV1). F-ratio derived from the training set: the larger this empirical value, the higher the malignancy risk. c Our histologically confirmed PTC or tumor-free samples were grouped according to the 26-variant set. Twenty-one benign samples out of the total 28 were actually assigned into the tumor-free group. Thirty-seven patients with PTC out of the total 39 were considered as malignant

