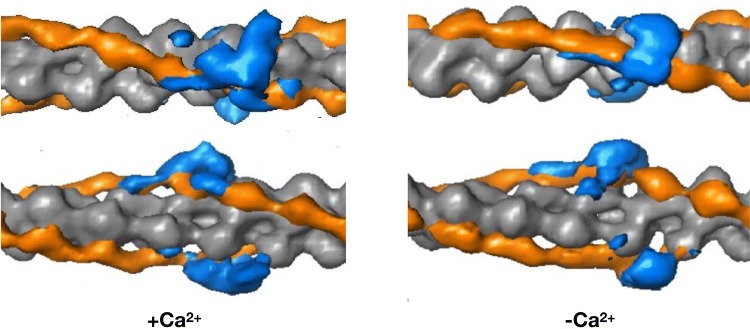
Fig. 14.
The barbed end (Z- band end) of the actin filament is on the left of the figure. Difference density maps calculated by subtracting docked F-actin (grey) and tropomyosin (orange) models from the single particle reconstructions leaving density attributable only to troponin (blue). Filament shown in two orientations rotated by 90°. The lower orientation approximates to the orientation in Figs. 1, 13 and 16. From (Paul et al. 2017) with permission. (Color figure online)

