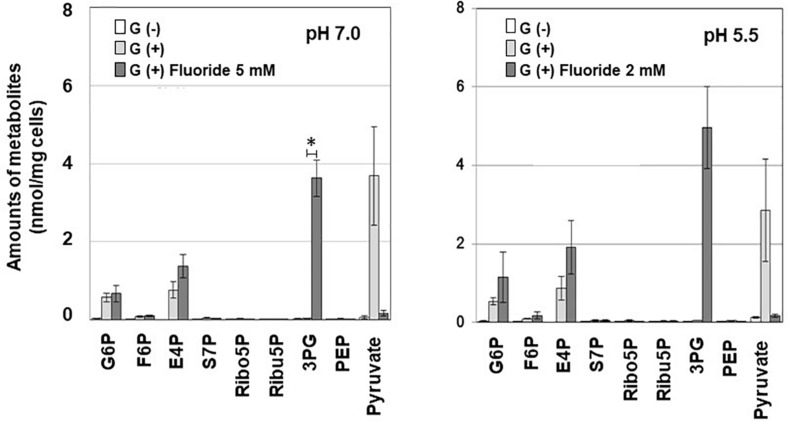
FIGURE 2.
Effects of fluoride on the metabolomic profile of S. wiggsiae at pH 7.0 and 5.5. Data are shown as the mean and standard deviation of three independent experiments. The significance of differences between the with and without fluoride conditions were analyzed using the paired t-test. The level of significance was set at 0.00556, based on Bonferroni’s correction (*P < 0.0056).

