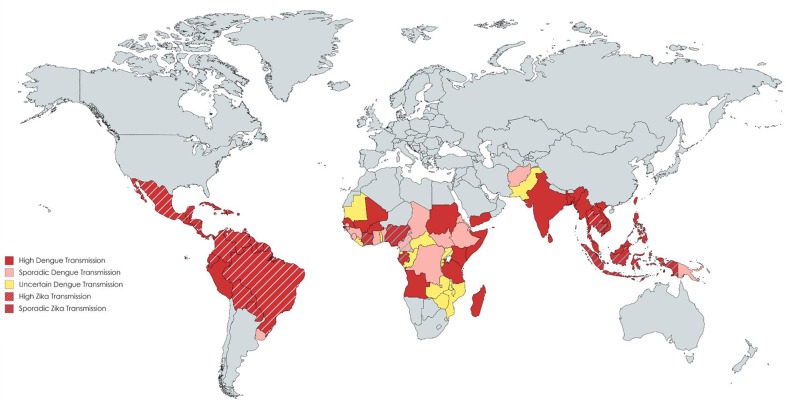
Figure 1.
Distribution of countries with Dengue and Zika transmission. Data compiled using the CDC yellow book and HealthMap©. Each color reflects a varying transmission rate from high dengue transmission (in red) to uncertain dengue transmission (in yellow). Countries with cross-hatched lines reflect those with high or sporadic Zika transmission.

