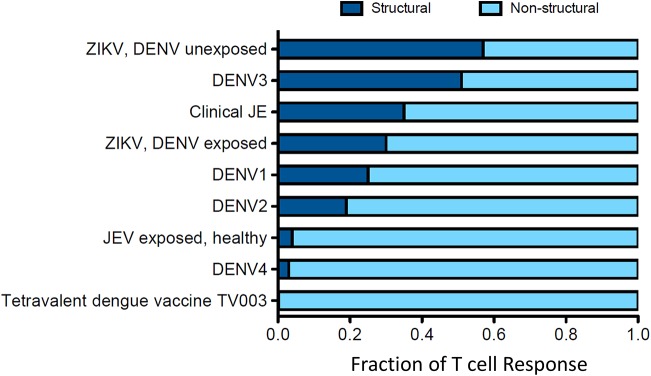
Figure 4.
Distribution of the T cell response to structural and non-structural components is influenced by prior clinical history. Data for this figure was compiled from the following studies: Turtle et al. (20), Weiskopf et al. (21, 56), Grifoni et al. (54), and Delgado et al. (57). T cell responses are from subjects with natural infections or vaccine recipients. Responses were identified by ELISPOT and intracellular cytokine staining (ICS) assays.

