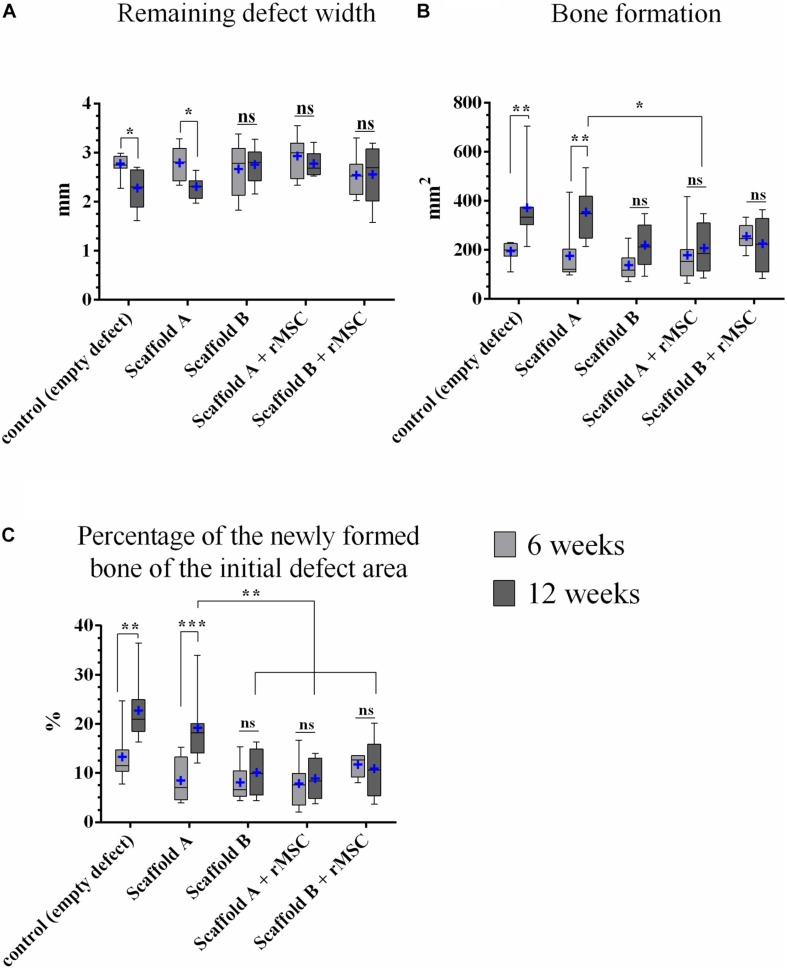
FIGURE 7.
Histomorphometric analysis. (A) Remaining defect width, (B) bone formation, and (C) percentage of the newly formed bone related to the initial defect area (n = 8; median and minimum/maximum values; mean is marked by +; *p < 0.05, **p < 0.01, ***p < 0.001). All mean values and standard deviations are shown in Supplementary Table S1.

