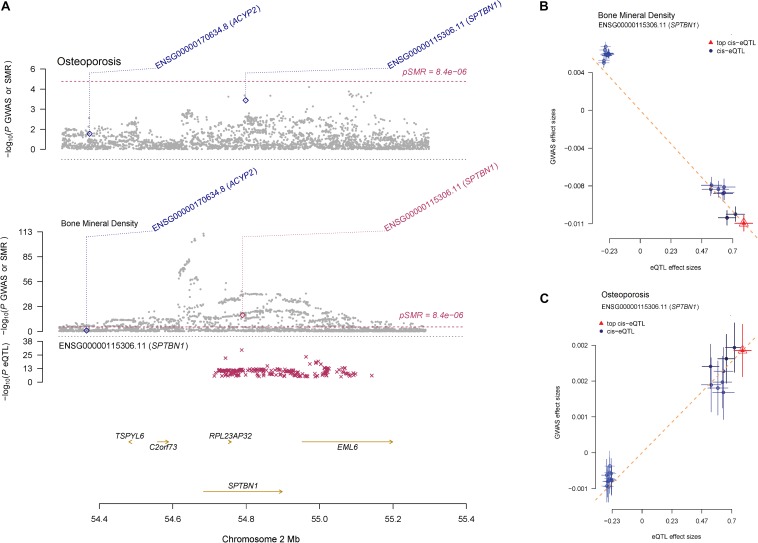
FIGURE 4.
The regulation mechanism of SPTBN1 locus for BMD and osteoporosis. (A) P-values of GWAS (gray dots) for BMD (top) and osteoporosis (middle) and P-value for the SMR test (diamonds) using the GTEx blood eQTL data. The bottom plot shows the eQTL P-values from GTEx blood tissue for the SPTBN1 gene (red stars). The dots shown in the plot include all the SNPs at these loci in the GWAS and eQTL summary data, respectively. (B, C) Effect sizes of SNPs from BMD (B) and osteoporosis (C) GWAS data against those from the GTEx blood eQTL data. The orange dashed lines represent effect size (bxy) of eQTL on phenotype. Error bars are the standard errors of SNP effects.

