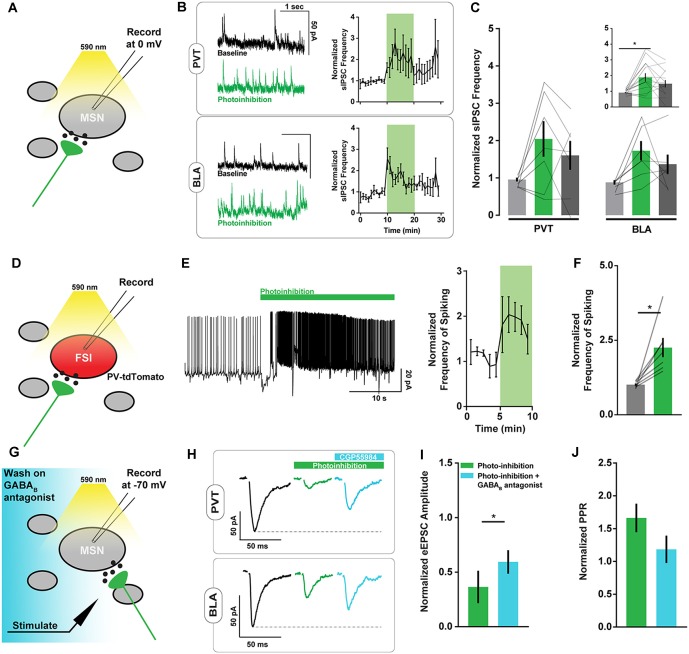
Figure 3.
ArchT-mediated inhibition of excitatory axons in the NAc increases spiny neuron spontaneous inhibitory postsynaptic currents (sIPSC) frequency and PV+ interneuron spiking. (A) Schematic of brain slice recording conditions where spontaneous IPSCs were recorded from NAc spiny neurons before, during, and after Arch-mediated photoinhibition of excitatory axon terminals. (B) Example NAc neuron recordings showing changes in sIPSC frequency during photoinhibition of PVT (top left) and BLA (bottom left) axons in the NAc. Summary of relative change in sIPSC frequency over time in response to photoinhibition (right). (C) Summary of effect of photoinhibition on sIPSC frequency. Inset shows data collapsed across pathways, highlighting main effect of photoinhibition [nPVT = 7(3 animals); nBLA = 7(3); F(2,24) = 7.26, p < 0.01; tbaseline vs. inhibition (24) = 3.79*]. (D) Schematic of brain slice recording conditions where spiking activity was recorded in tdTomato-labeled PV+ fast-spiking interneurons (FSIs) during Arch-mediated photoinhibition of excitatory afferent inputs. (E) Example recording from a PV+ interneuron in the NAc showing elevated spiking activity coincident with Arch-mediated axon terminal photoinhibition (left). Summary of relative change in FSI spiking frequency over time in response to photoinhibition (right). (F) Summary of effect of photoinhibition on normalized interneuron spiking [n = 7(2); t(6) = 3.64, p < 0.05]. (G) Schematic of brain slice recording conditions, where electrically-evoked EPSCs were recorded from NAc spiny neurons during Arch-mediated photoinhibition of excitatory axon terminals in the presence of a GABAB antagonist (CGP55984). (H) Example NAc neuron recordings showing the effects of a GABAB antagonist on evoked EPSC amplitudes during photoinhibition of PVT (top) and BLA axons (bottom). (I,J) Summary of effect of GABAB antagonist on evoked EPSC amplitude [n = 3(2); t(2) = 5.51, p < 0.05] and normalized pulse-paired ratio (PPR; t(2) = 2.90, p = 0.10) during photoinhibition of excitatory axon terminals. Baseline data not shown. Error bars represent SEM. *Signifies p < 0.05. FSI, fast-spiking interneuron; MSN, the medium spiny neuron.

