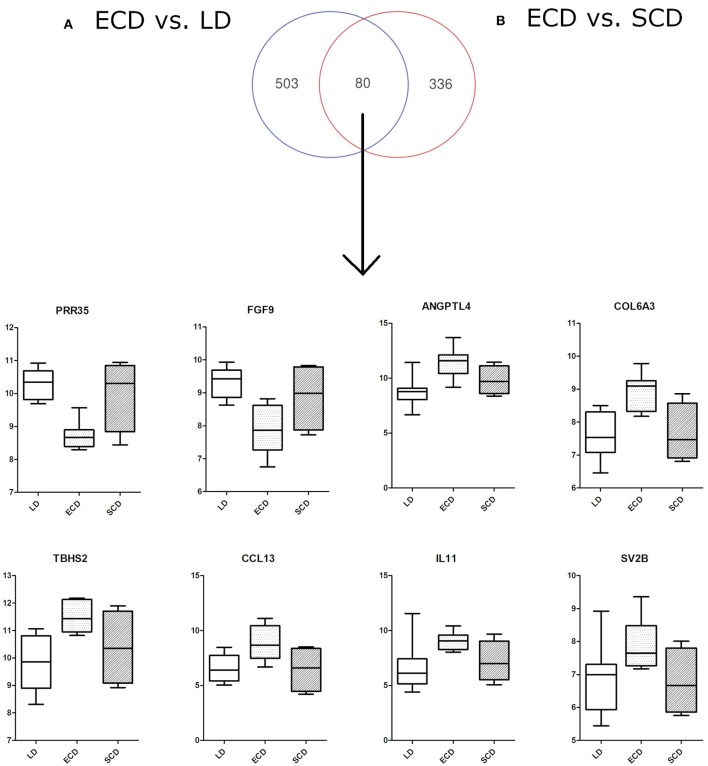
Figure 2.
Venn diagram showing overlap of deregulated genes (80 transcripts) for particular comparisons of donor categories: (A) ECD vs. LD (583 deregulated transcripts), (B) ECD vs. SCD (416 deregulated transcripts). The overlap of some genes shows differential expression of ECD compared with SCD and LD. PRR35, proline-rich 35 protein; FGF9, fibroblast growth factor 9; ANGPTL4, angiopoietin-like 4; COL6A3, collagen, type VI, alpha 3; TBHS2, thrombospondin 2; CCL13, chemokine (C-C motif) ligand 13; IL11, interleukin 11; SV2B, synaptic vesicle glycoprotein 2B.

