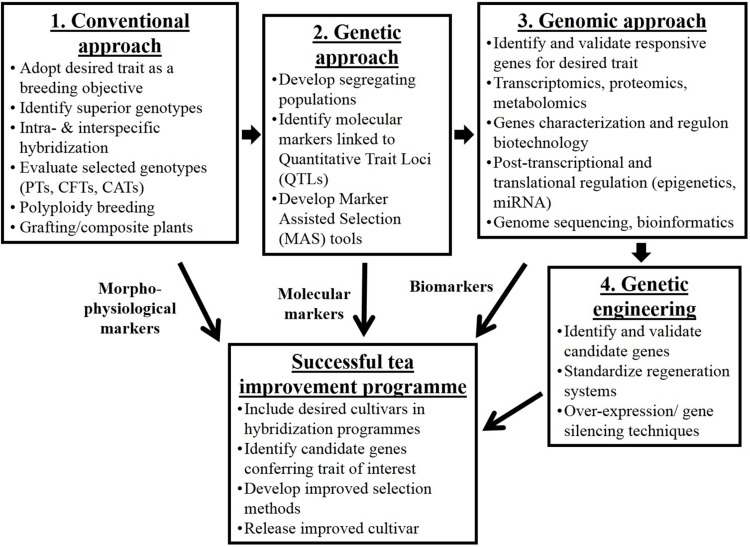
FIGURE 3.
Schematic diagram on tea improvement strategies and techniques that have evolved over a period of time. Arrows in between boxes 1, 2, 3, and 4 show the evolutionary time scale of the development of the strategies. CATs, clonal adaptability trials; CFTs, clonal field trials; MAS, marker assisted selection; PTs, progeny trials; QTLs, quantitative trait loci.

