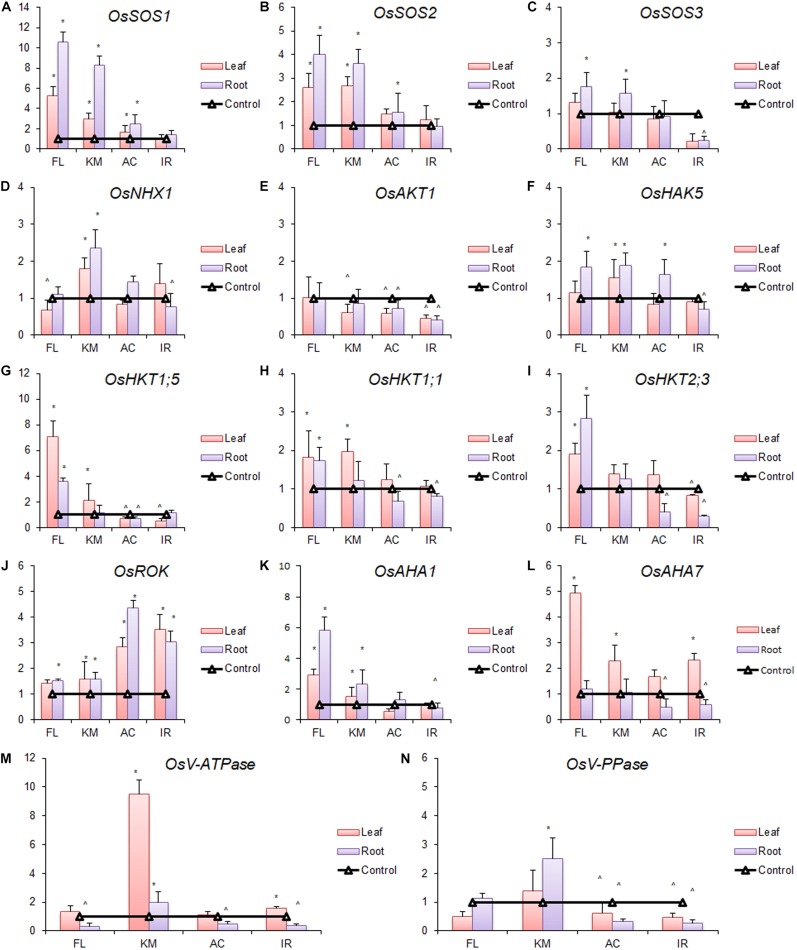
FIGURE 8.
Changes in expression profile (relative expression in terms of 2–Δ Δ CT fold change) of different Na+/H+ transporters, viz., OsSOS1 (A), OsSOS2 (B), OsSOS3 (C), and OsNHX1 (D); different K+/Na+ transporters, viz., OsAKT1 (E), OsHAK5 (F), OsHKT1;5 (G), OsHKT1;1 (H), and OsHKT2;3 (I); OsROK (J); plasma membrane H+ pumps, viz., OsAHA1 (K) and OsAHA7 (L); and vacuolar H+ pumps, viz., OsV-ATPase (M) and OsV-PPase (N) in roots and leaves of four rice genotypes subjected to 2 days of salt stress (12 dS m–1), where FL:FL478; KM:Kamini; AC:AC847; and IR:IR29. * and ^ denote significant upregulation and downregulation, respectively, in comparison with control. The values presented are the mean ± SE of three independent biological and two technical replications.

