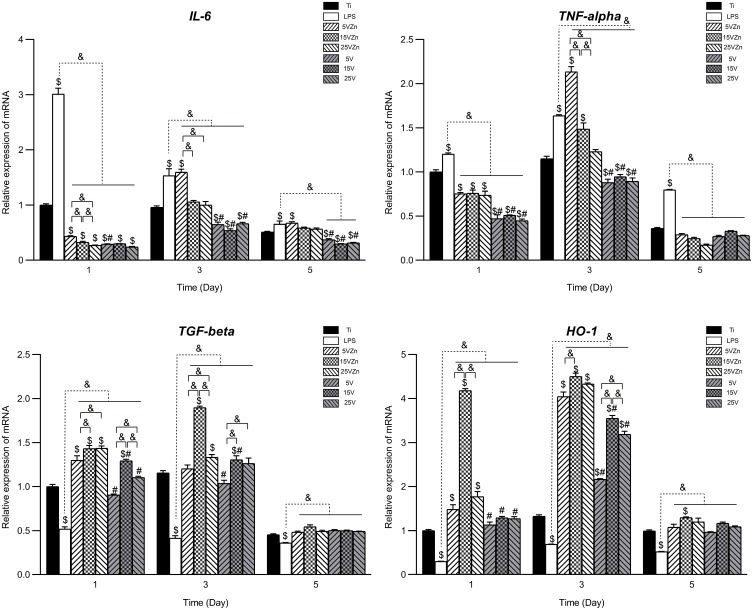
Figure 10.
Gene expression changes of inflammation-associated cytokines assayed by qPCR.
Notes: Data are expressed as the mean ± standard deviation (n=3). $Denotes the statistical significance between Ti and other groups. #Denotes the statistical significance between each Zn-incorporated TNT group and its TNT counterpart group. &Denotes the statistical significance between different labeled groups. ($P<0.05, #P<0.05, &P<0.05, ANOVA.)
Abbreviation: qPCR, quantitative real-time polymerase chain reaction.

