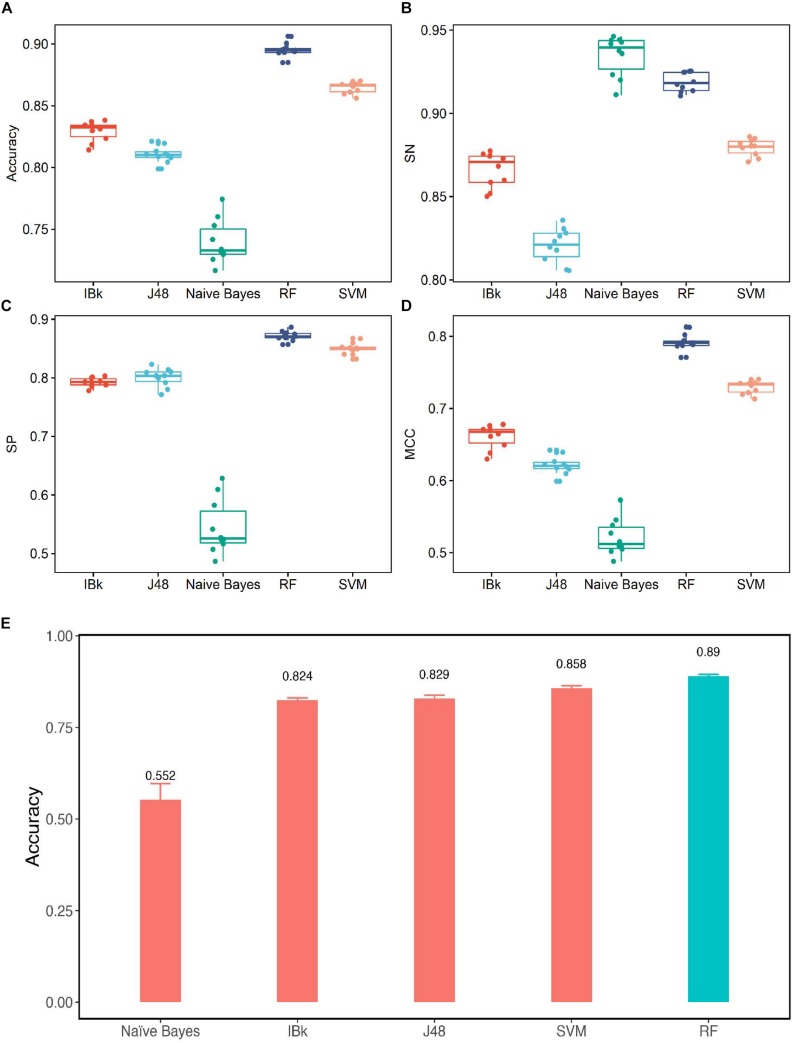
FIGURE 5.
Performance of different classifier. (A) Accuracy comparison for the training sets by using all the classification methods. (B) Sensitivity comparison for the training sets using all of the classification methods. (C) Specificity comparison for the training sets by using all of the classification methods. (D) Matthew’s correlation coefficient comparison for training sets by using all the classification methods. (E) Accuracy comparison for the testing sets by using all of the classification methods.

