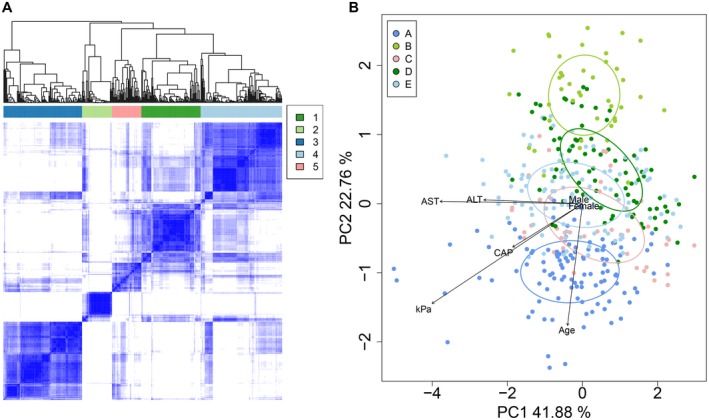
Fig. 2.

Consensus clustering with PAM identified five groups of subjects based on bile acid profiles. (A) Similarity matrix for the five clusters of subjects. (B) Principal component analysis based on log10 bile acid abundances shows separation of the five clusters. Ellipses were drawn using the SD of point scores. Selected clinical variables were fitted onto the plot using the envfit function in the Vegan package.
