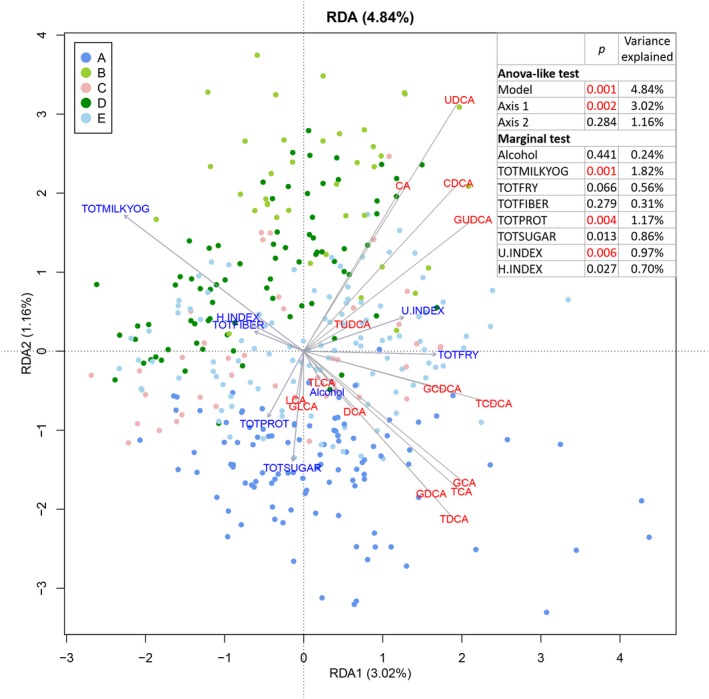
Fig. 6.

Triplot of the redundancy analysis in 376 subjects, after exclusion of those with missing variables. The first two canonical axes are shown. Explanatory variables (dietary components) are shown in blue, and response variables (log10‐transformed bile acids) are shown in red. Abbreviations: ANOVA, analysis of variance; H.INDEX, healthy eating index; RDA, redundancy analysis; TOTFIBER, total fiber; TOTFRY, total fried foods; TOTMILKYOG, total milk and yogurt; TOTPROT, total protein; TOTSUGAR, total sugar; U.INDEX, unhealthy eating index. P values <0.01 are shown in red.
