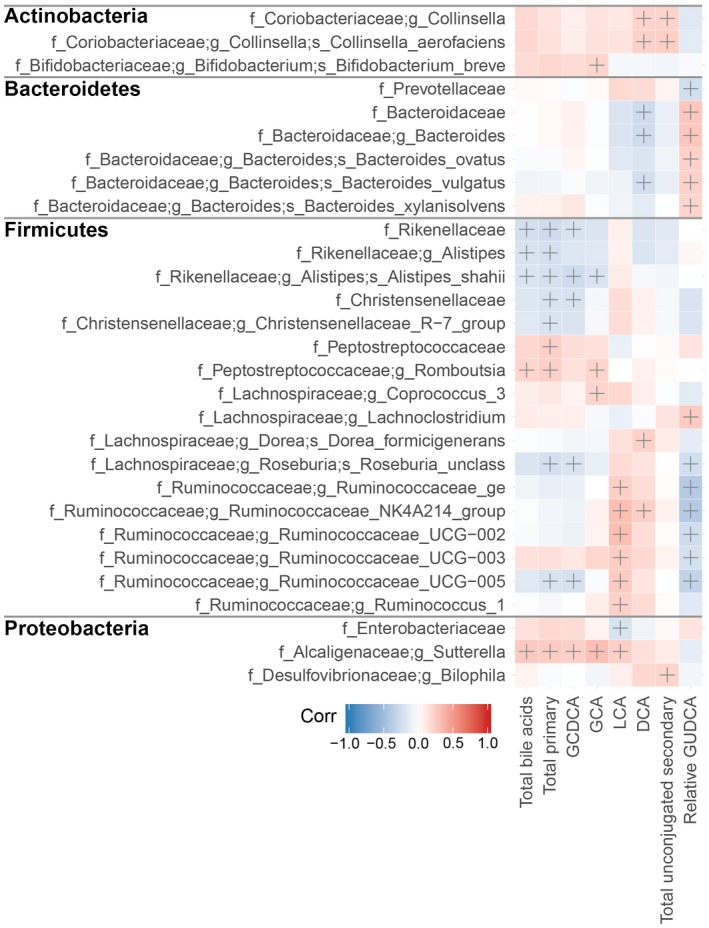
Fig. 7.

Heatmap showing Spearman's correlations between selected bile acid parameters and stool microbiome features, grouped by phylum (phlyum names in bold). Classifications at the family (f_), genus (g_), and species (s_) levels are shown. Crosses (+) indicate significant correlations (|r| ≥ 0.2 and P < 0.05.
