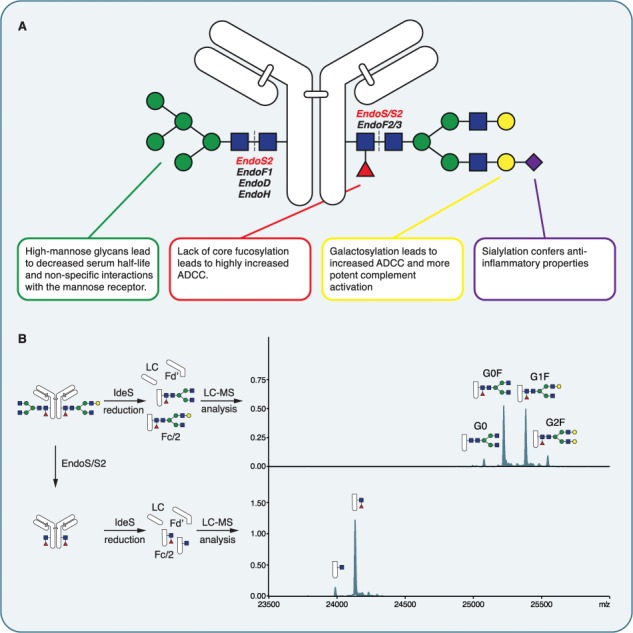
Fig. 1.

IgG Fc glycosylation. (A) Schematic representation of IgG glycosylation with a short summary of the main glycan features and their effects on IgG effector functions. The digestion sites for the different endoglycosidases are marked. (B) Hydrolysis of IgG Fc glycans by EndoS/EndoS2 analyzed by middle-level mass spectrometry. After treatment with endoglycosidase, the mAbs were cleaved with IdeS and reduced and the resulting subunits were analyzed by LC-MS. The deconvoluted spectra of the Fc/2 fragment reveals the glycosylation pattern of the mAb in the control sample (top) and demonstrates complete glycan hydrolysis after endoglycosidase treatment (bottom).
