Fig. 3.
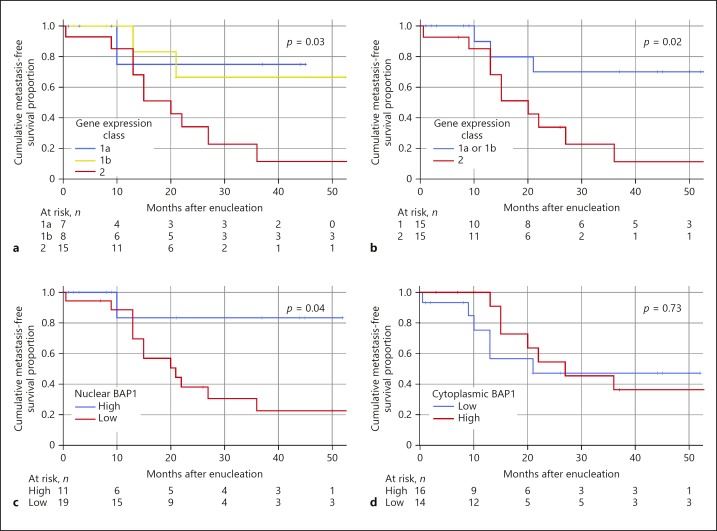
Kaplan-Meier cumulative metastasis-free survival proportion after enucleation. a Patients with tumours with gene expression class 2 (red) versus 1a (blue) and 1b (yellow) (log-rank p for trend = 0.03). b Patients with tumours with gene expression class 2 (red) versus class 1a or 1b (blue, log-rank p = 0.02). c Patients with tumour with low nuclear BAP1 expression (red) versus high (blue, log-rank p = 0.04). d Patients with tumours with low cytoplasmic BAP1 expression (blue) versus high (red, log-rank p = 0.73).

