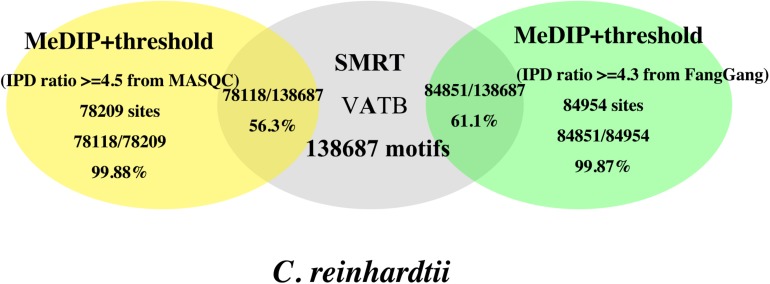
FIGURE 7.
Comparison of accuracies of the 6mA events and VATB (V = A/G/C, B = G/C/T) motifs in C. reinhardtii using the threshold from MASQC and Fang’s method. The yellow ellipse is the proportion of the 6mA sites and motifs filtered by MASQC; the gray ellipse is the number of total motifs in C. reinhardtii; The green ellipse is the proportion of the 6mA sites and motifs filtered by Fang’s method.

