Figure 3.
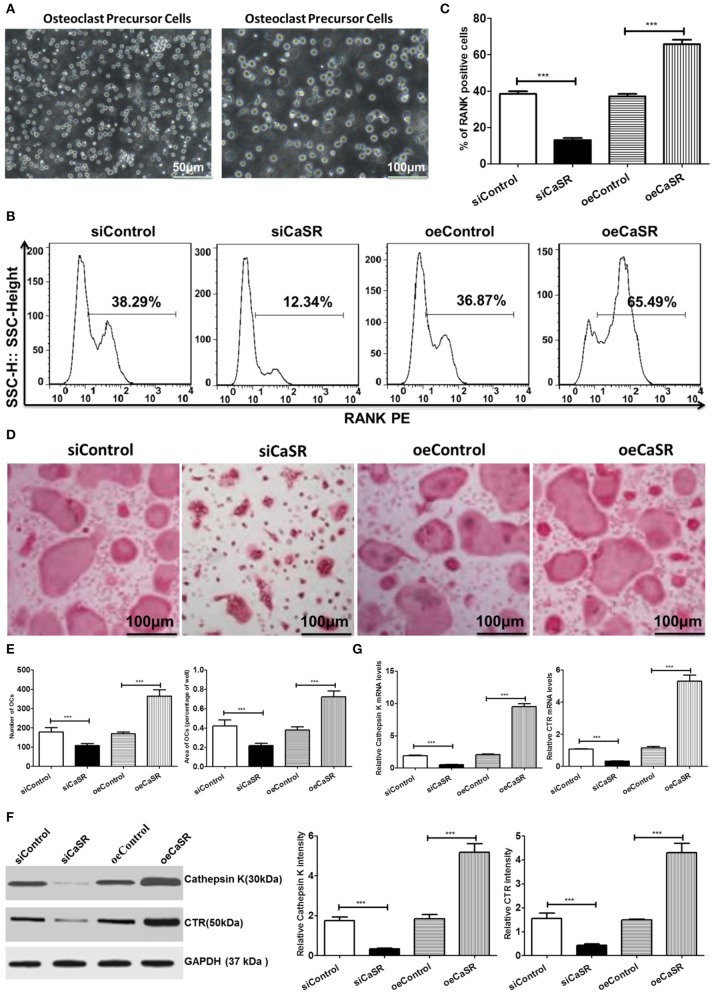
Analysis of CaSR effects on OCs. (A) Isolation and identification of OC precursor cells. (B–E) Four groups of OC precursor cells were treated with CM from modified A549 cells co-cultured with macrophages to examine potential OC differentiation induction. Flow cytometry was used to detect expression of RANK-positive OCs. TRAP+ multinucleated cells were counted using 400-fold microscope and TRAP-stained OC area was calculated using ImageJ software (NIH). OC number and osteolytic area size in CaSR overexpression group were significantly higher than those in empty vector and negative control groups (p < 0.001). The difference between negative and empty vector control groups was not statistically significant (p > 0.05). (F) Protein expression levels of bone matrix degradation-related enzymes cathepsin K and CTR were detected by western blot after CaSR overexpression and knockdown in A549 cells. ImageJ software (NIH) for image processing was used to verify band intensities as a result of semi-quantitative western blots. Protein expression levels of cathepsin K and CTR were significantly higher in CaSR overexpression group than in empty vector and negative control groups (p < 0.001). (G) The qPCR was used to detect expression of bone matrix degradation-related enzymes cathepsin K and CTR mRNA levels after CaSR overexpression and knockdown. Cathepsin K and CRT mRNA expression levels were significantly higher in CaSR overexpression group than in empty vector and negative control groups (p < 0.001). ***p < 0.001.

