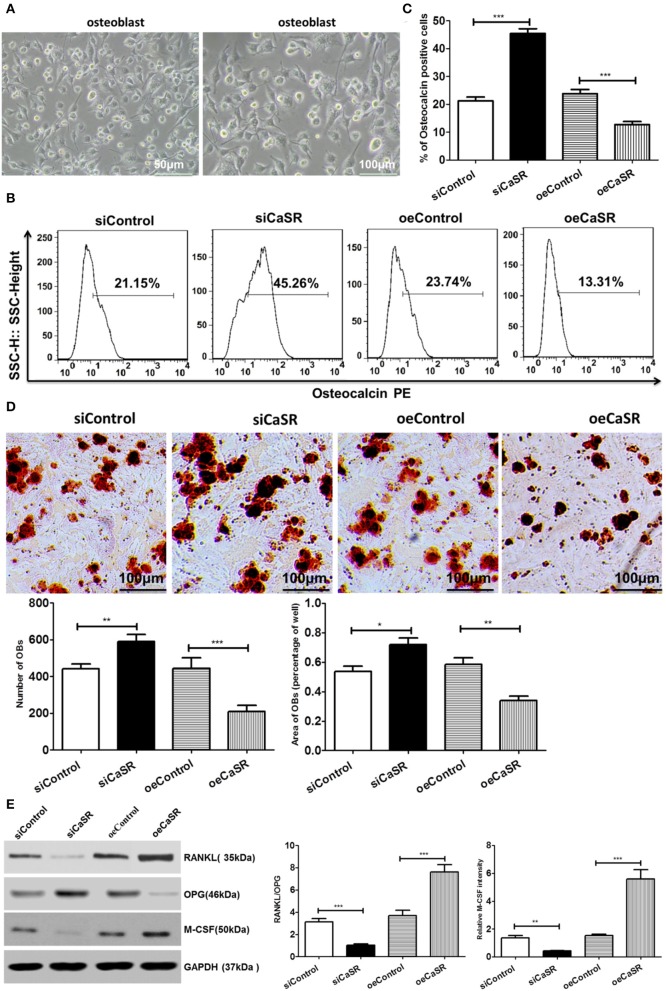
Figure 5.
Analysis of CaSR effects on OBs. (A) Primary culture and identification of rat OBs. (B–D) Four groups of OB precursor cells were treated with CM from co-cultured modified A549 cells with macrophages to examine potential OB differentiation induction. Flow cytometry was used to detect expression of osteocalcin-positive OBs. OB mineralization nodule staining was performed with Alizarin Red S (AS). AS+ cells were counted using 400-fold microscope and AS-stained OB area was calculated using ImageJ software (NIH). The number of OBs in CaSR overexpression group was significantly lower than that in empty vector and negative control groups (p < 0.001). There was no significant difference between empty vector and negative control groups (p > 0.05). Osteogenic area in CaSR overexpression group was significantly smaller than that in empty vector and negative control groups (p < 0.001). While there was a difference between negative and empty vector control groups, this difference was not statistically significant (p > 0.05). OB number and osteogenic area size were significantly higher in CaSR knockdown group than in empty vector and negative control groups (p < 0.001). (E) OB expression induced OC maturation and differentiation enzymes RANKL, M-CSF, and OPG were detected using western blots. ImageJ software (NIH) for image processing was used to verify band intensities as a result of semi-quantitative western blotting. RANKL and M-CSF protein expression was significantly higher in CaSR overexpression group than in empty vector control group. OPG protein expression level was significantly lower in CaSR overexpression group than in empty vector and negative control groups (p < 0.001). *p < 0.05, **p < 0.01, ***p < 0.001.

