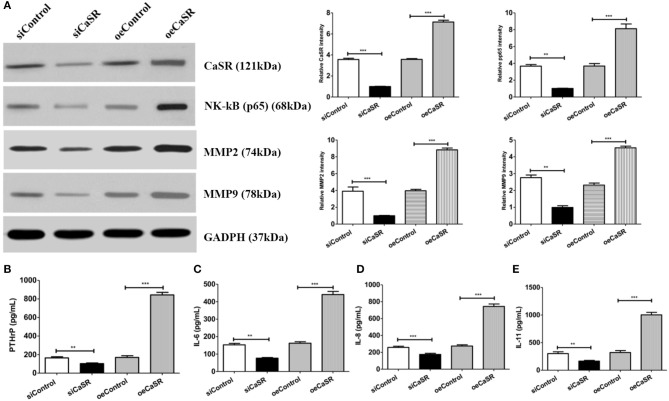
Figure 7.
Analysis of cytokine expression levels. (A) Western blotting confirmed NF-κB, MMP2, and MMP9 expression levels. ImageJ software (NIH) was used for image processing to verify band intensities as a result of semi-quantitative western blots. NF-κB expression level in CaSR overexpression group was significantly higher than that in empty vector and negative control groups. NF-κB, MMP2, and MMP9 expression levels were significantly lower in CaSR knockdown group than in empty vector and negative control groups (p < 0.001). (B) PTHrP expression levels in CM from modified A549 cells co-cultured with macrophages were detected by ELISA. PTHrP expression level was significantly higher in CaSR overexpression group than in empty vector and negative control groups. PTHrP expression level was significantly lower in CaSR knockdown group than in empty vector and negative control groups (p < 0.001). (C–E) IL-6, IL-8, and IL-11 expression in CM from modified A549 cells co-cultured with macrophages were detected by ELISA. IL-6, IL-8, and IL-11 expression levels were significantly higher in CaSR overexpression group than in empty vector and negative control groups. Expression levels of these three factors were significantly lower in CaSR knockdown group than in empty vector and negative control groups (p < 0.001). **p < 0.01, ***p < 0.001.

