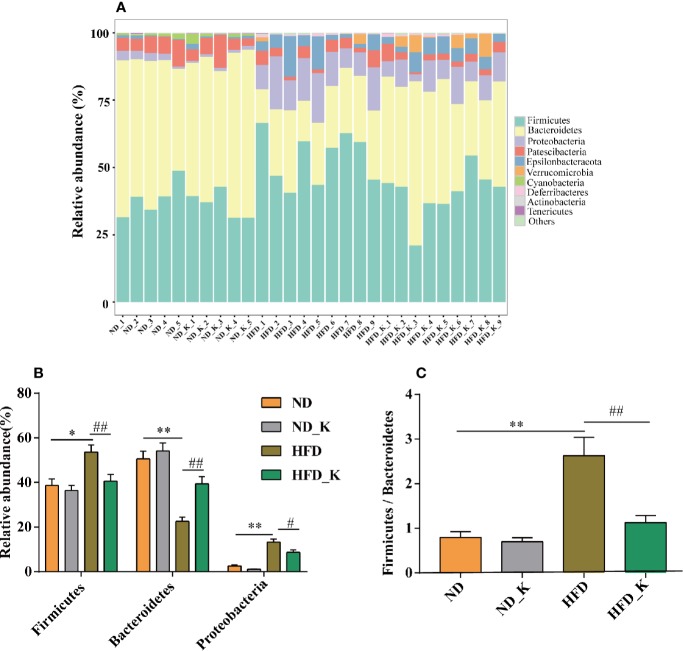
Figure 3.
KSLP affected the relative abundance of gut microbiota at the phylum level. (A) The relative abundance of the 10 top-ranked phyla were presented. (B) The relative abundance of Firmicutes, Bacteroidetes, and Proteobacteria. (C) The ratio of Firmicutes/Bacteroidetes. Compared with ND group, *p < 0.05, **p < 0.01. Compared with HFD group, #p < 0.05, ##p < 0.01.

