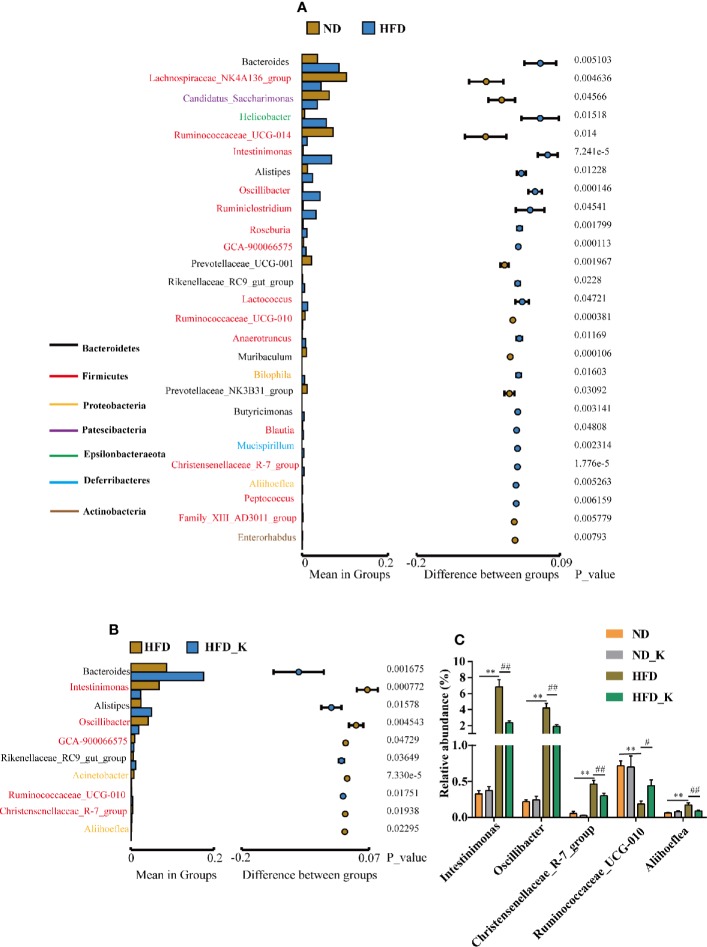
Figure 5.
KSLP affected the relative abundance of gut microbiota at the genus level. (A) Genera between ND and HFD groups with significant differences were presented. The list of genera with font color refers to their phyla. The histograms presented the mean relative abundance of genera whereas the circular colors represented the differences in confidence intervals. The p values for corresponding genus resulting from inter-group significance test were displayed. (B) Genera between HFD group and HFD_K group with significant differences were presented. (C) The genera responding to HFD and reversed by KSLP treatment. Compared with ND group, **p < 0.01. Compared with HFD group, ##p < 0.01, #p < 0.05.

