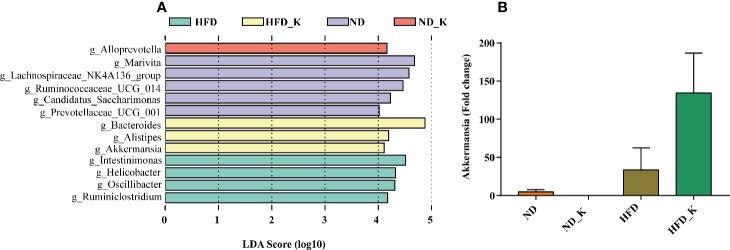
Figure 6.
Key phylotypes responding to the KSLP treatment in HFD mice. (A) Linear discriminant analysis (LDA) scores were computed for taxa with differential abundance in the fecal microbiota of ND (purple), ND_K (red), HFD (green), and HFD_K (yellow) mice. The LDA score indicated the effect size and ranking of each differentially abundant taxon (LDA > 4). (B) Real-time qPCR analysis. The relative expression of Akkermansia was expressed as the fold change in comparison to the ND group.

