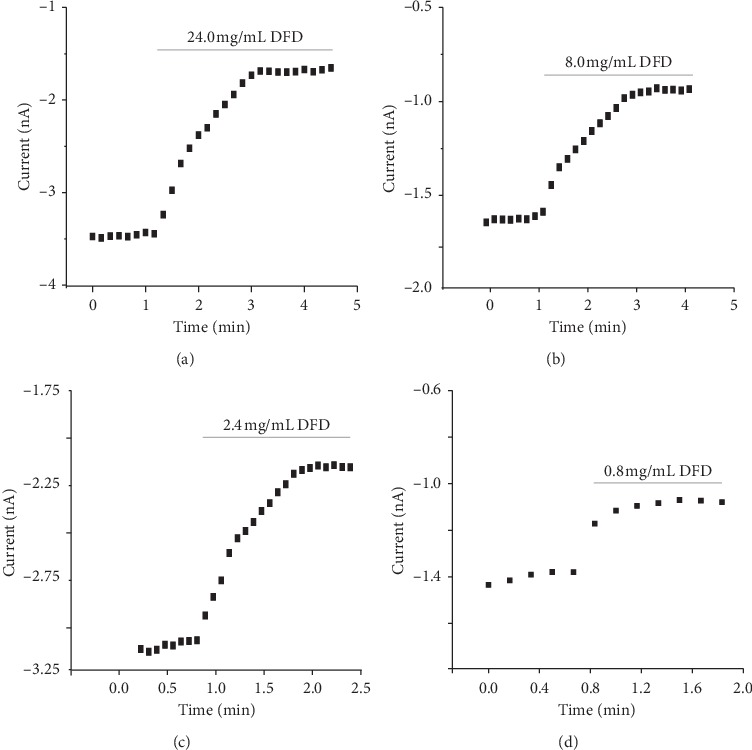
Figure 3.

Time-history diagram of the effect of different DFD concentrations on Nav1.5 current in CHO cells. (a) Time-history diagram of the effect of 24.0 mg/mL DFD on Nav1.5 current in CHO cells. (b) Time-history diagram of the effect of 8.0 mg/mL DFD on Nav1.5 current in CHO cells. (c) Time-history diagram of the effect of 2.4 mg/mL DFD on Nav1.5 current in CHO cells. (d) Time-history diagram of the effect of 0.8 mg/mL DFD on Nav1.5 current in CHO cells.
