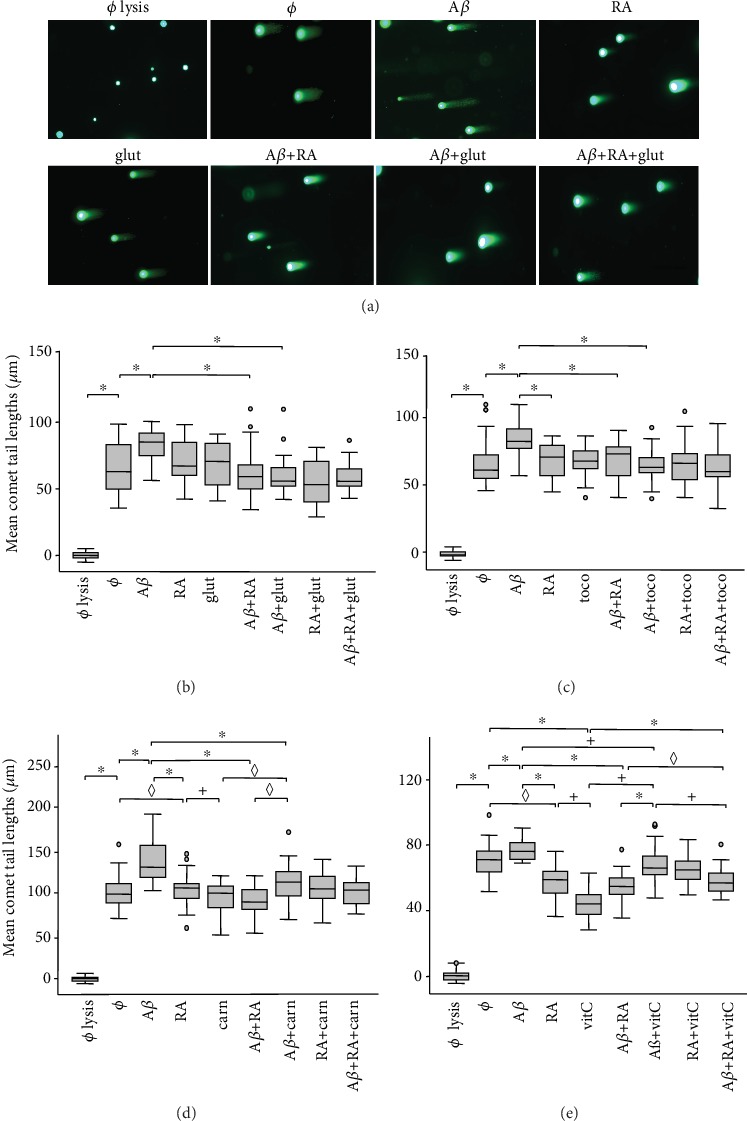
Figure 2.

Effects of antioxidants against Aβ-induced (20 μM) DSBs in SH-SY5Y cells compared to all-trans-retinoic acid (RA; 5 μM) treatment. In (a), example of comet assay with 1 h treatments with Aβ, RA, and/or glutathione (glut). Scale bar: 200 μM. In (b) to (e), data analyses: (b) glutathione (1 μM), (c) α-tocopherol (toco; 1 μM), (d) L-carnosine (carn; 100 μM), and (e) vitamin C (vitC; 100 μM). Box plots of mean comet tail lengths (number of cells measured: 18 < n < 53). ANOVA with Bonferroni correction: the experiments with L-carnosine and vitamin C were repeated 3 times (◊p < 0.05 for 1 experiment out of 3; +p < 0.05 for 2 experiments out of 3; ∗p < 0.05 for 3 experiments out of 3) whereas the experiments with glutathione and α-tocopherol were carried out 1 time (∗p < 0.05). ø = without treatment.
