
Figure 5.
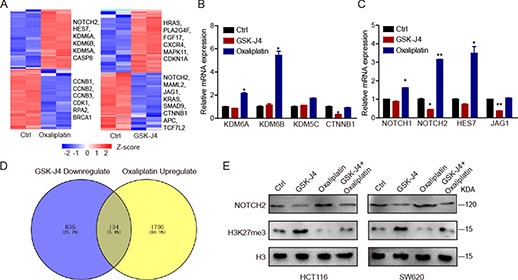
GSK-J4 inhibits oxaliplatin-induced NOTCH2 expression. (A) Heatmap shows the expression profiles of variably expressed genes across control, oxaliplatin (50 μM)-treated, and GSK-J4 (1 μM)-treated cells. (B and C) Detection of GSK-J4 (1 μM) or oxaliplatin (50 μM)-induced changes in KDM genes (B) or NOTCH-related genes (C). (D) Venn diagram indicates oxaliplatin-upregulated and GSK-J4-downregulated genes. (E) Western blot detection of NOTCH2 expression after oxaliplatin (50 μM) and GSK-J4 (1 μM) treatment.