
Figure 6.
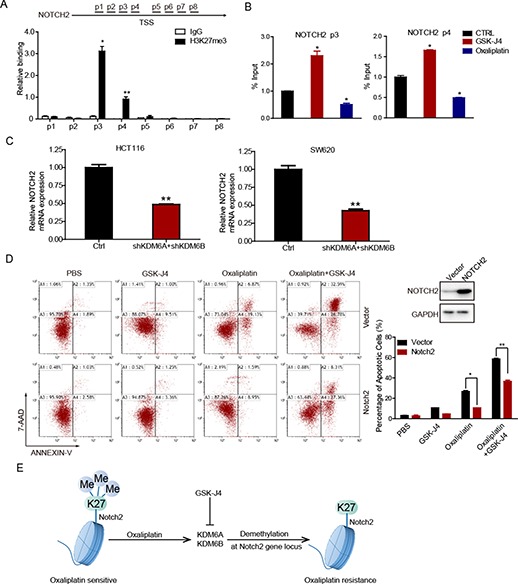
Oxaliplatin and GSK-J4 alter NOTCH2 expression by affecting the level of H3K27me3 transcription initiation region. (A) ChIP-qPCR analysis of H3K27me3 binding to the NOTCH2 promoter in HCT116 cells. (B) ChIP-qPCR analysis of anti-H3K27me3 in control and GSK-J4 (1 μM) or oxaliplatin (50 μM)-treated cells. (C) qRT-PCR detection of KDM6A/KDM6B expression after NOTCH2 knockdown. (D) Western blot detection of NOTCH2 expression in NOTCH2 overexpression HCT116 cells (upper right panel). NOTCH2 overexpression and control HCT116 cells were treated with GSK-J4 (1 μM) and exposed to oxaliplatin (50 μM) for 48 h. The percentage of cells entering apoptosis was determined by flow cytometry using APC-labeled Annexin V and 7-AAD staining. (E) Graphic illustration of the relationship between H3K27me3 and oxaliplatin resistance.