
. 2020 Mar 17;22(3):e15790. doi: 10.2196/15790
©Kerstin Frie, Jamie Hartmann-Boyce, Susan Jebb, Jason Oke, Paul Aveyard. Originally published in the Journal of Medical Internet Research (http://www.jmir.org), 17.03.2020.
This is an open-access article distributed under the terms of the Creative Commons Attribution License (https://creativecommons.org/licenses/by/4.0/), which permits unrestricted use, distribution, and reproduction in any medium, provided the original work, first published in the Journal of Medical Internet Research, is properly cited. The complete bibliographic information, a link to the original publication on http://www.jmir.org/, as well as this copyright and license information must be included.
Figure 4.
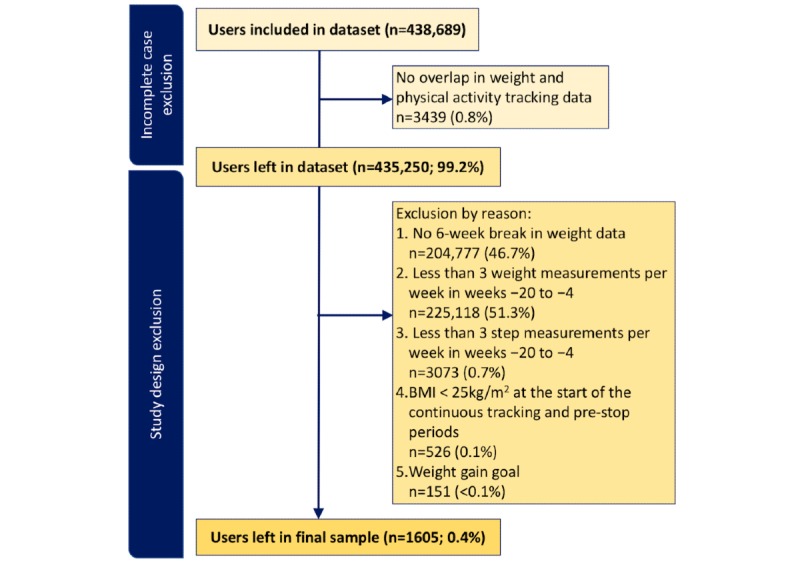
Flow diagram of the exclusion rates at each step.