
Figure 1.
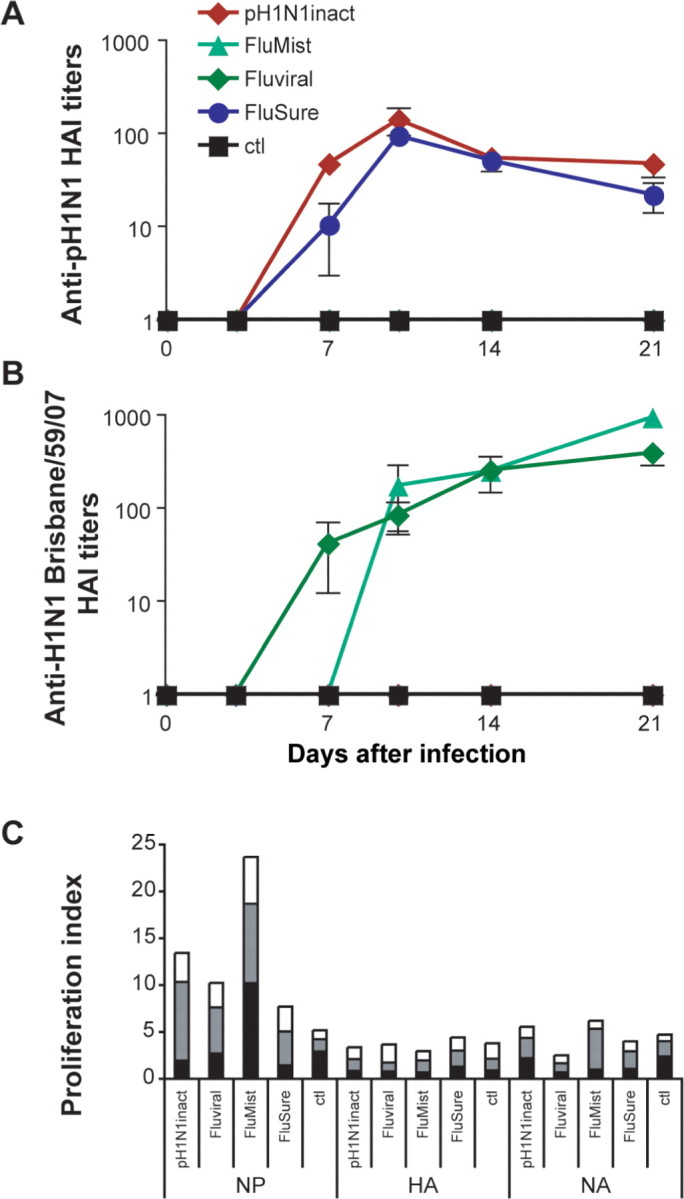
Humoral and cellular immune responses elicited by the different vaccines. Quantification of hemagglutination-inhibiting antibody titers against H1N1 A/Mexico/InDRE4487/2009 (MX10) (A) and H1N1 A/ Brisbane/59/07 (B) over the first 21 days after immunization. Data points denote the mean of all values obtained for the respective groups, and error bars denote the standard error. C, Proliferation activity of peripheral blood mononuclear cells (PBMCs) isolated on day 10 after immunization, upon stimulation with 3 pools of overlapping peptides covering the nucleocapsid (NP), neuraminidase (NA), and hemagglutinin (HA) proteins of the H1N1 strain Brevig Mission/1/1918. The proliferation index denotes the ratio of influenza peptide pool-stimulated and Ebola control peptide- stimulated values. The average proliferation observed in each group for a respective pool is shown, and the individual pools are denoted by black, gray, or white bars. Ctl, nonimmunized control group; HAI, hemagglutination-inhibiting antibodies.