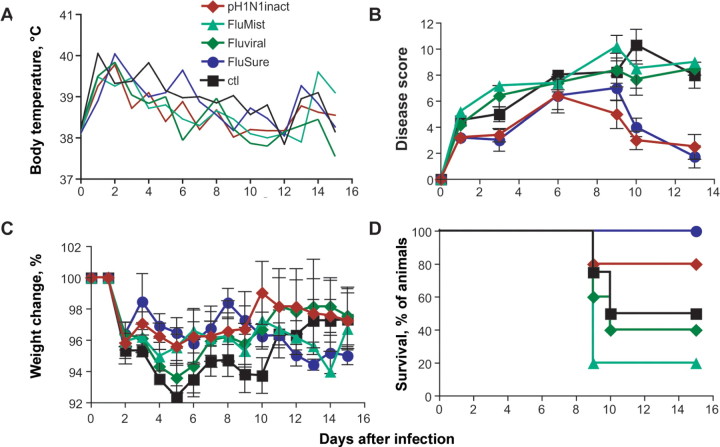
Figure 2.
Clinical assessment after challenge with MX10. Five weeks after immunization, the animals were challenged with 105 50% tissue culture infectious doses of MX10. Temperature (A) and weight (B) were determined daily, and clinical signs (C) were scored at least every third day over the course of the disease. Data points denote the mean of all values obtained for the respective groups, and error bars denote the standard error. D, Survival curve of animals in the different groups. Ctl, nonimmunized control group.

