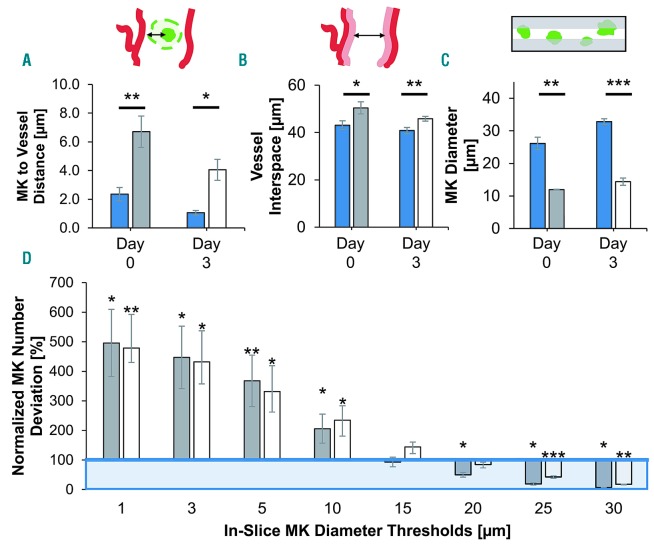
Figure 1.
Comparison of data derived from full image stacks and virtual slices. Data displayed for two time points: before induced thrombopoiesis with generally smaller megakaryocytes (day 0, dark gray bars) and after with very large megakaryocytes (day 3, white bars) in comparison to three-dimensional stack ground truth (blue bars/box). Virtual slices extracted from full image stacks. Binary mask of stack megakaryocytes (=ground truth) was used for in-slice megakaryocyte segmentation (see inset 1C). Bar graphs represent the mean ± standard deviation (SD). Two-parameter t-test: stack vs. virtual slice data for day 0 and day 3, respectively. *P<0.05; **P<0.01; ***P<0.001. (A) Mean megakaryocyte-to-vessel distance is increased in slices compared to full stack analysis. (B) Measured vessel interspace is significantly greater in virtual slices than in full stacks. (C) Mean megakaryocytes diameter is massively underestimated in virtual slices. (D) Megakaryocyte numbers in slices deviate significantly from stack ground truth depending on diameter threshold of the megakaryocytes. Megakaryocyte numbers normalized to equal marrow volume; percentage relative to stack ground truth. Mk: megakaryocyte.

