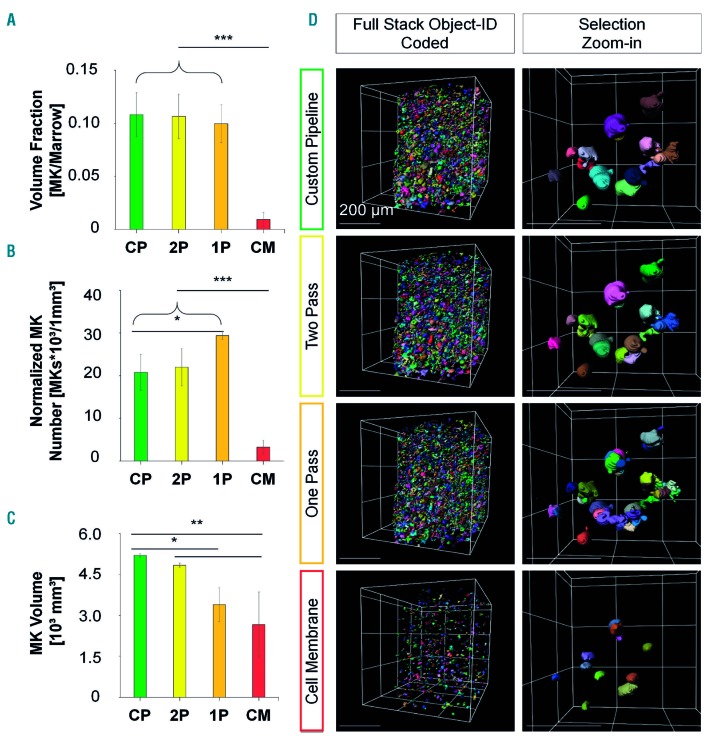
Figure 2.
Segmentation performance of the customized pipeline compared with the one-/two-pass pipelines and the Imaris cell membrane algorithm on day 0. (A-C) Data depicted for the customized pipeline (CP; green bars), two-pass pipeline (2P; yellow bars), one-pass pipeline (1P; orange bars), and Imaris cell membrane algorithm (CM; red bars) before induced thrombopoiesis (day 0). (A) Megakaryocyte-to-marrow volume fraction is comparable between the customized and one-/two-pass pipelines with a massive decrease when the Imaris cell membrane algorithm is used. (B) Normalized mean megakaryocyte numbers are comparable with the customized and two-pass pipelines, whereas they are significantly increased with the one-pass pipeline and massively decreased with the Imaris cell membrane algorithm. (C) Customized and two-pass pipelines deliver comparable mean megakaryocyte volumes, whereas those yielded by the one-pass pipeline or the Imaris cell membrane algorithm are significantly decreased. Bar graphs represent the mean ± standard deviation. *P<0.05; **P<0.01; ***P<0.001 (one-way analysis of variance, Tukey post-hoc test). (D) Exemplified segmentation results. Left column: full stack with segmented megakaryocytes, object ID color-coded. Sparsely located megakaryocytes with cell membrane algorithm opposed to other pipelines. Right column: zoom-in to selection. Megakaryocyte fragmentation is higher in the one-and two-pass pipelines compared to the customized pipeline. Cell membrane algorithm with sparse and small megakaryocytes. Grid size and scale bar = 200 µm. Mk: megakaryocyte.

