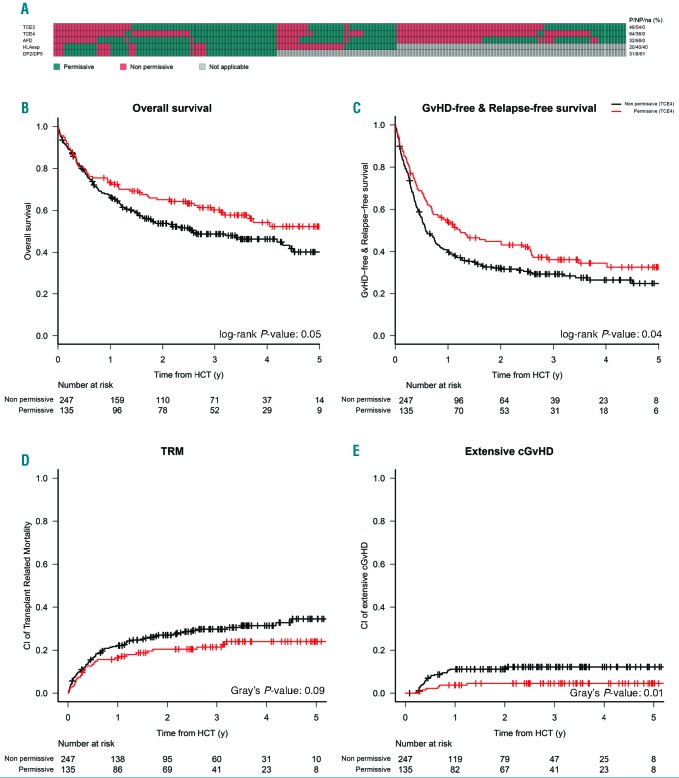
Figure 1.
Comparative stratification of donor-recipient pairs according to five different biological models of DPB1 permissiveness, and outcome associations for TCE4. (A) Classification of the 382 DPB1 mismatched pairs under analysis in this study, as permissive or low risk (green) or as non-permissive or high risk (red) group according to five different biological models of permissiveness, as described in the text. For the Expression model and the DP2/DP5 model, only pairs with single mismatches in the graft-versus-host (GvH) direction can be stratified, the others cannot be classified (grey). The model under investigation, and the relevant numbers in each category (green, red or grey) are indicated to the left and to the right of the panel, respectively. The bottom panels show Kaplan-Meier probabilities for overall survival (OS) (B), graft-versus-host disease-free relapse-free survival (GRFS) (C), and commorbidity index (CI) of non-relapse mortality (NRM) (D) and extensive chronic graft-versus-host disease (cGvHD) (E) stratified for functional DPB1 matching according to TCE4 model, with permissive and non-permissive groups represented by the red and black curves, respectively. TRM: transplant-related mortality; HCT: hematopoietic cell transplantation; y: years.

