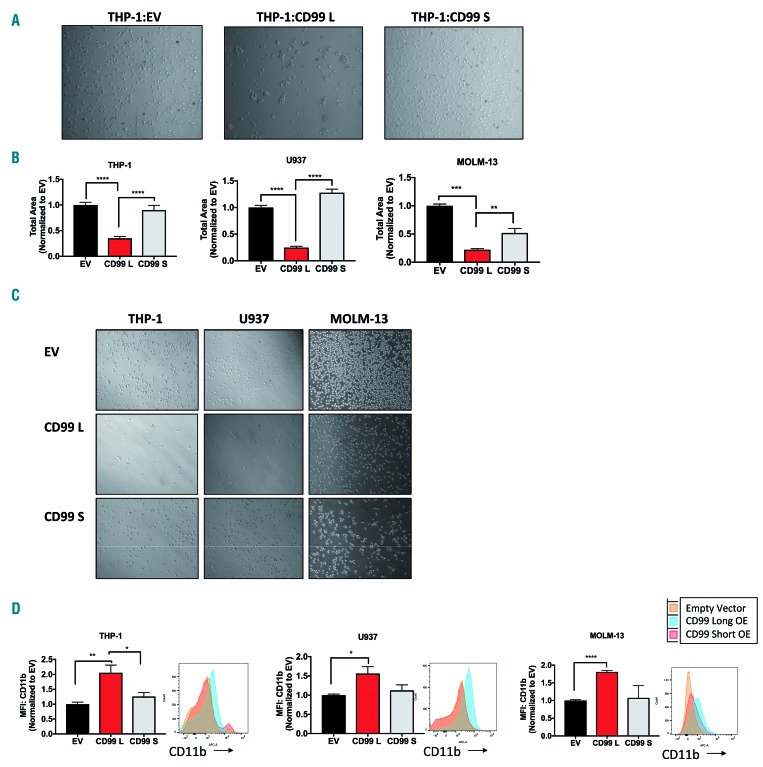
Figure 5.
Functional analysis of CD99-L and CD99-S isoform overexpression in vitro. (A) Representative images for aggregation assay of THP-1 EV, CD99-L and CD99-S cells taken 6 hours (h) after seeding. (B) Migration of EV, CD99-L, and CD99-S in THP-1, U937, and MOLM 13 cells ana-lyzed by measuring cells that migrated towards SDF-1α using transwell plates (n=3). (C) Representative images for migration assay of EV, CD99-L, and CD99-S in THP-1, U937, and MOLM-13 cells. (D) CD11b analysis of EV, CD99-L, and CD99-S cells measured by flow cytometry in THP-1, U937, and MOLM-13 cells (n=4). (**** P<0.0001; *** P<0.001; ** P<0.01; * P<0.05).

