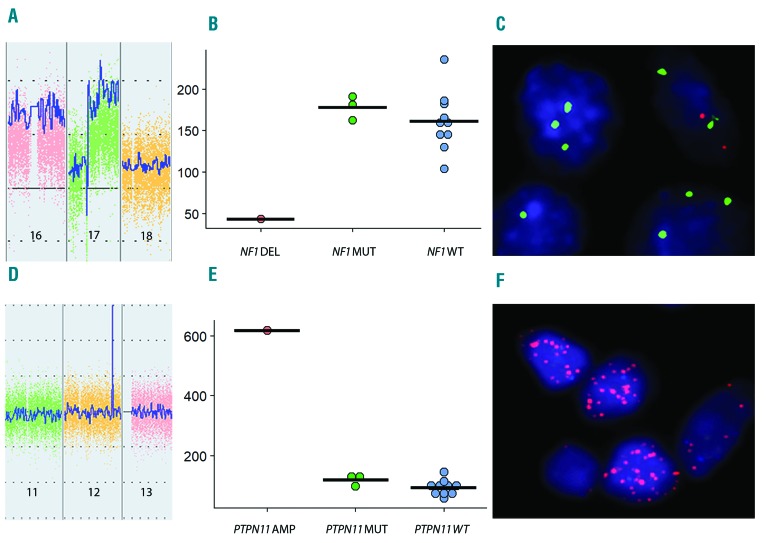
Figure 3.
NF1 homozygous deletion. (A) Inverted peak in chromosome 17 consistent with homozygous deletion of NF1 (ChAS 3.3). (B) Reduction in NF1 transcript in the case with homozygous deletion (DEL) compared with NF1 mutated (MUT) and wild-type (WT) cases [normalized RNA-sequencing (RNA-Seq) count data]. (C) Fluorescence in situ hybridization (FISH) showing multiple copies of the CEP 17 probe (green) with loss of the NF1 probe (orange) (D-F). PTPN11 amplification. (D) Peak in chromosome 12 consistent with high-level amplification of PTPN11 (ChAS 3.3). (E) Increased PTPN11 transcript in the amplified (AMP) case compared with PTPN11 mutated (MUT) and wild-type (WT) cases (normalized RNA-Seq count data). (F) FISH showing multiple copies of the PTPN11 gene (orange) in a double minute pattern.

