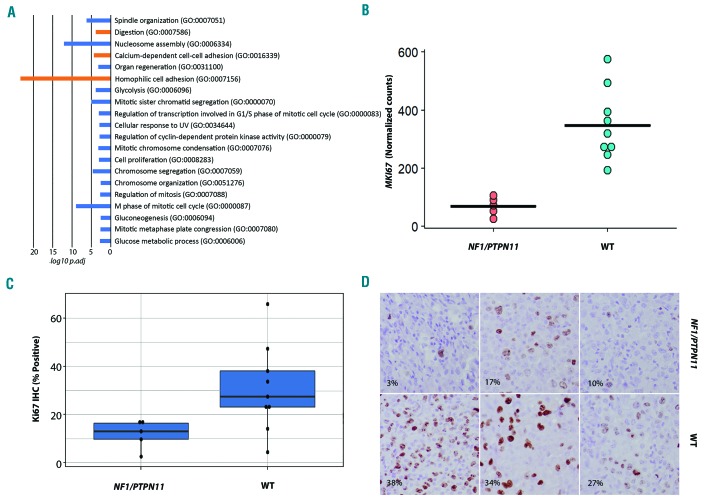
Figure 6.
Cell cycle and proliferation. (A) The -log10 adjusted P-values of the top 20 GO Biological Processes (GeneSetDB Gene Ontology) by gene set enrichment analysis using EGSEA, sorted by average rank. There is enrichment for cell cycle and proliferation-related processes in the NF1/PTPN11 wild-type (WT) cases (blue) relative to the cases with NF1/PTPN11 alterations. (B) Normalized counts from RNA-sequencing data showing differences in MKI67 transcript between the NF1/PTPN11 altered and NF1/PTPN11 WT groups. (C) Bar plot of the difference in proliferation index between the tumor subgroups by Ki67 immunohistochemistry. (D) Photomicrograph showing immunohistochemical expression of Ki67 in the tumor subgroups.

