
Fig. 3.
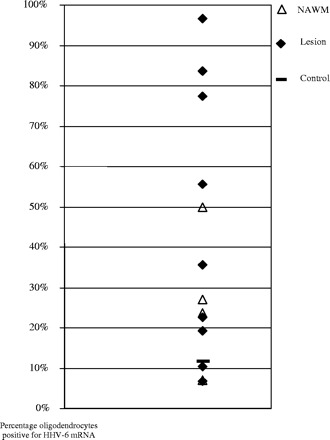
Scatterplot representing the data presented in Table 2. Each point represents an individual sample. The control sample value is represented by a broad line, lesional samples are filled diamonds and NAWM are open triangles. As two of the control samples had undetectable HHV-6 mRNA, only the third sample appears on this graph representing what has to be considered a normal level of HHV-6 infection in oligodendrocytes.