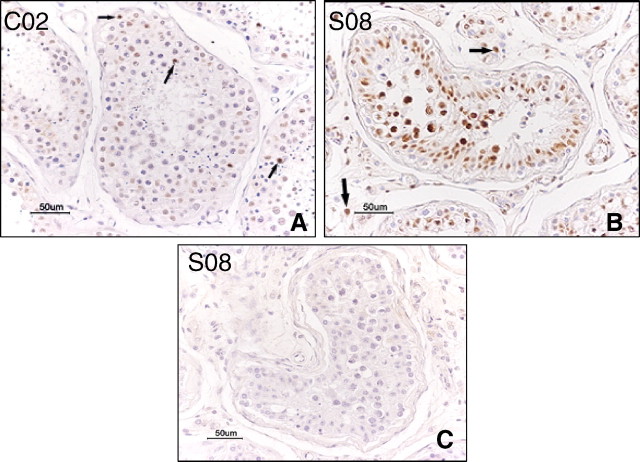
Fig. 2.
TUNEL stain. A) Testis from the control case C02, showing a few apoptotic spermatogenetic cells in the tubules (arrows). B) Testis from SARS patient S08, showing increased apoptotic spermatogenetic cells and a few positive Leydig cells (arrows). C) Negative control stain of SARS sample S08 without TdT in the staining process, no positive stain was seen. Bar = 50 μm

