
. 2007 Nov 2;99(1):2–13. doi: 10.1093/jhered/esm081
© The American Genetic Association. 2007. All rights reserved. For permissions, please email: journals.permissions@oxfordjournals.org.
This article is made available via the PMC Open Access Subset for unrestricted re-use and analyses in any form or by any means with acknowledgement of the original source. These permissions are granted for the duration of the COVID-19 pandemic or until permissions are revoked in writing. Upon expiration of these permissions, PMC is granted a perpetual license to make this article available via PMC and Europe PMC, consistent with existing copyright protections.
Figure 3.
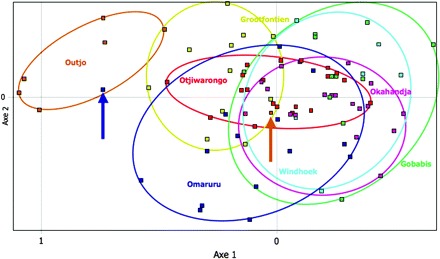
Population cluster graph from PCA of 7 subpopulations in Namibia.