
Figure 4.
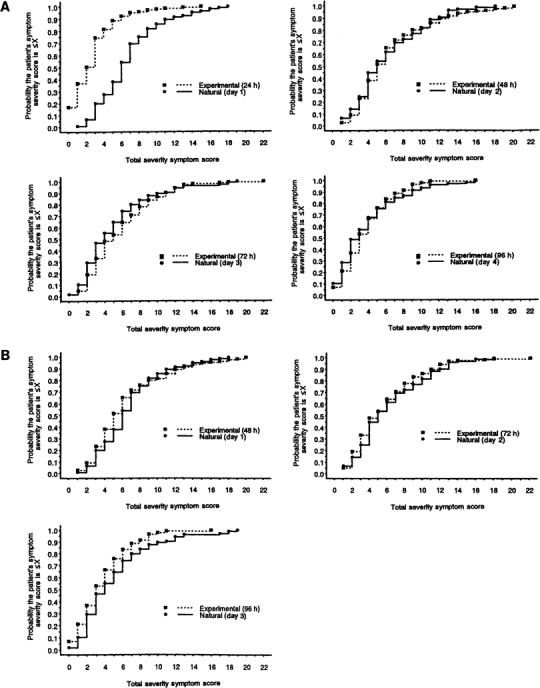
Comparison of the cumulative distribution of total symptom severity scores, by time point, in 105 patients with natural colds and 141 subjects with experimental colds. A, Day 1 of illness for natural colds compared with 24 h after inoculation for experimental colds. B, Day 1 of illness for natural colds compared with 48 h after inoculation for experimental colds.