
Figure 1.
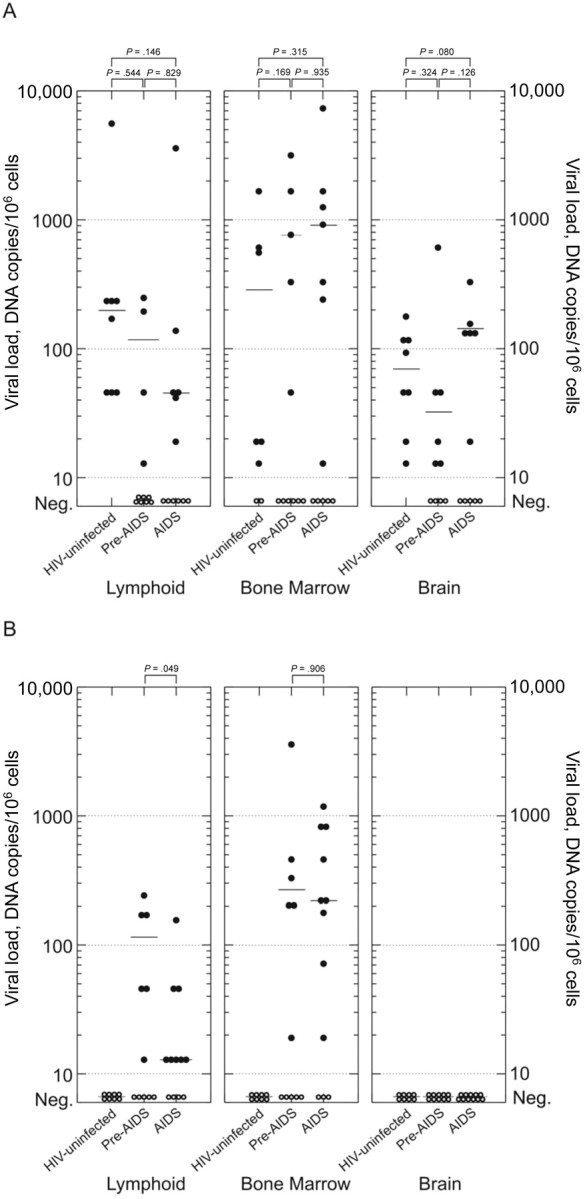
Viral loads for parvoviruses B19 (A) and PARV4 (B) in different tissues from the study subjects, plotted on a log scale (y-axis). Bars indicate median values for positive samples (filled circles). The significance of the differences in viral loads between subject categories was calculated by use of the Mann-Whitney U test.