Fig. 3.

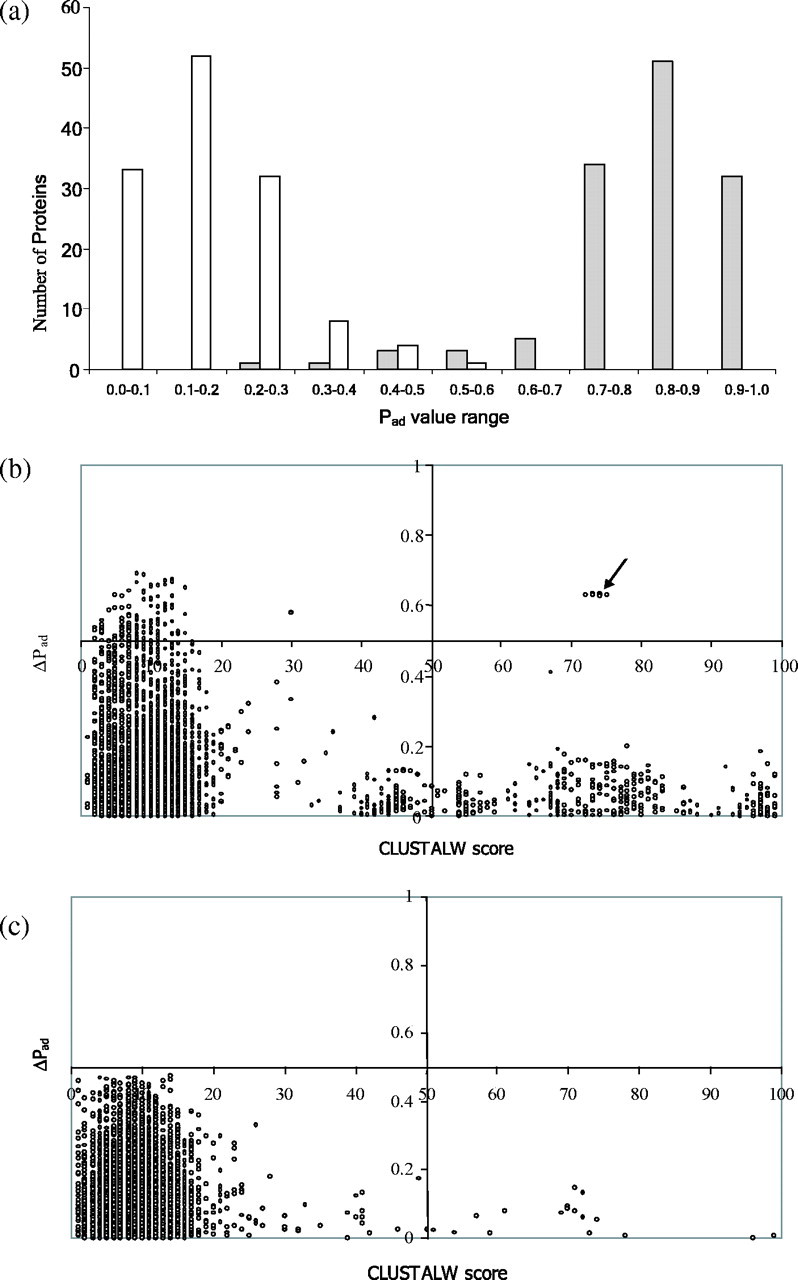
SPAAN is a non-homology-based software program. A total of 130 adhesins and 130 non-adhesins were analyzed to assess whether the predictive power of SPAAN could be influenced by sequence relationships. (a) Histogram plots of the number of proteins in the various Pad value ranges are shown. Shaded bars represent adhesins and open bars represent non-adhesins. Note the ability of SPAAN to segregate adhesins and non-adhesins into two distinct cohesive groups. (b) Pairwise sequence relationships among the adhesins were determined using CLUSTALW and plotted on x-axis. Higher CLUSTALW scores indicate similar pairs. The corresponding differences in Pad values in the same protein pair was plotted on the y-axis. Each point in the diagram represents a pair. Arrow points to protein pairs of the FimH family with high ΔPad values in spite of high similarity. Since one of the FimH proteins (gi: 5524636) had very low Pad value, all pairs with this false negative protein show high ΔPad values. The protein (gi: 5524636) is of much shorter length compared with other members of the same family. (c) Plot for non-adhesins. Data were plotted in the four-quadrant format to enhance clarity.
