Figure 2.

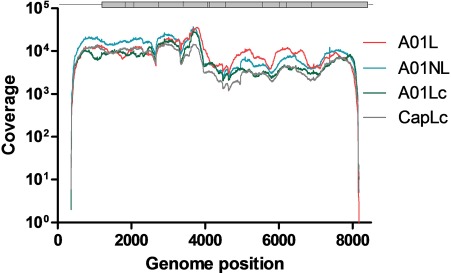
Coverage distribution of sequenced samples. The coverage distribution for the sequenced samples obtained with filtered, trimmed reads. Each sample is indicated with different colors. The FMDV genome is represented at the top of the figure.

Coverage distribution of sequenced samples. The coverage distribution for the sequenced samples obtained with filtered, trimmed reads. Each sample is indicated with different colors. The FMDV genome is represented at the top of the figure.