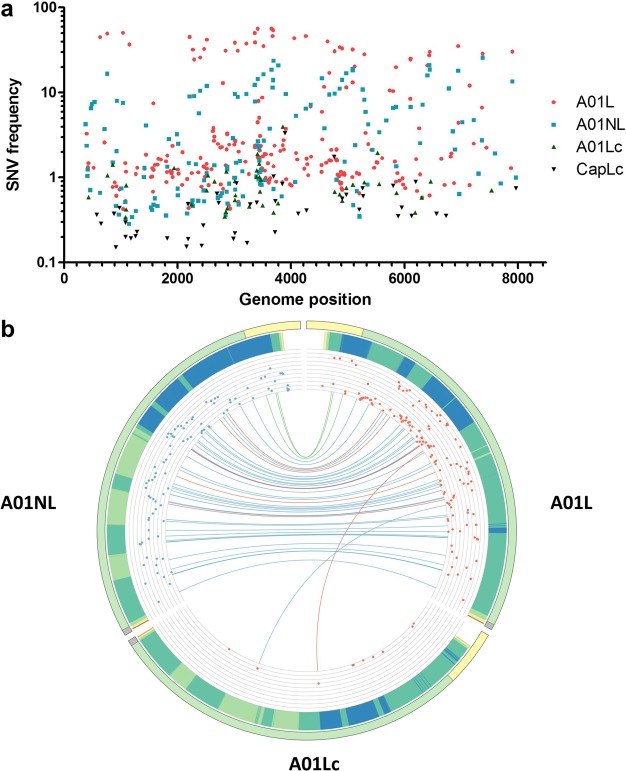
Figure 3.

Distribution of SNVs across the FMDV genome. (A) The frequency of the variants detected in each sample is indicated with different colors and symbols. (B) Circos histogram displaying the similarity between A01L, A01NL and A01Lc genomes. Variants with frequency above 1% that were called by LoFreq are shown. The FMDV genome is represented with a line and divided in three regions with different colors (light yellow: 5′UTR, light green: polyprotein-coding sequence, grey: 3′UTR) in the periphery of the circle. The light blue bars represent the frequency of each variant detected (in log scale). Variants shared by two samples (A01L and A01NL or A01L and A01Lc) are linked by the colored lines (light green: non-coding mutation, light blue: synonymous mutation, light red: non synonymous mutation).
