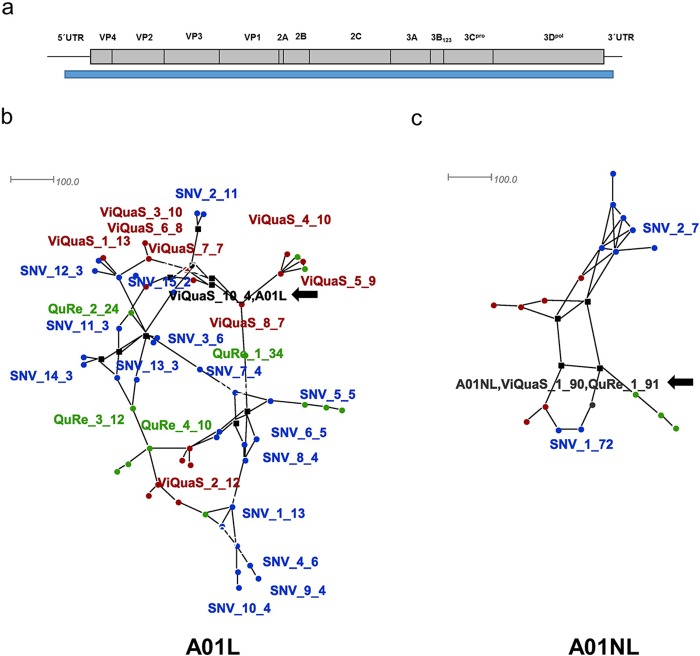
Figure 4.

Haplotype networks for A01L and A01NL viruses. Haplotype networks were created under the Median-joining method (with epsilon = 0 to minimize the distances) using SplitsTree4 software. (A) FMDV genome representation. The blue bar indicates the genomic region used for haplotype reconstruction. (B) A01L haplotype network. (C) A01NL haplotype network. Font color indicates the program used to obtain the corresponding haplotype: green for QuRe, red for ViQuaS and blue for CliqueSNV. Black color indicates sequences obtained by more than one software; Sanger consensus sequences were included as reference. Only haplotypes representing 75 % of total frequency are presented. For each sequence, the name indicates the software that was used for the analysis, number of haplotype and estimated frequency.
