-
A
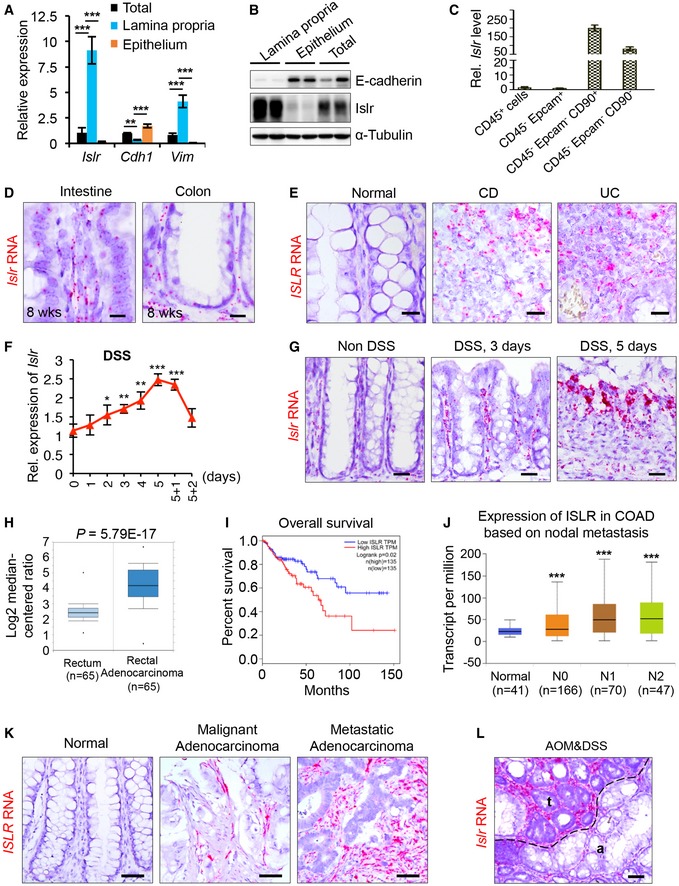
qRT–PCR analysis for Islr, Chd1, and Vim in total intestinal tissues, intestinal epithelium, and lamina propria; n = 4.
-
B
Western blotting for Islr and E‐cadherin in total intestinal tissues, intestinal epithelium, and lamina propria. α‐Tubulin was used as a loading control.
-
C
qRT–PCR analysis for Islr in CD45+, CD45−Epcam+, CD45−Epcam−CD90+, and CD45−Epcam−CD90− cells sorted from intestinal tissues; n = 3 technical replicates.
-
D
In situ hybridization for
Islr with RNAscope probe in intestine and colon from 8‐week‐old mice, showing that
Islr is primarily expressed in stromal cells. Negative and positive controls are shown in
Appendix Fig S1A. Scale bar: 25 μm.
-
E
In situ hybridization for ISLR with RNAscope probe in human mucosa, and inflamed mucosa from CD and UC patients. Scale bar: 25 μm.
-
F
qRT–PCR analysis showing the dynamic changes in Islr in colonic tissues from mice upon DSS treatment and after DSS removal; n = 4 at each timepoints.
-
G
In situ hybridization for Islr with RNAscope probe in mouse colons without or with 3‐day or 5‐day DSS treatments. Scale bar: 50 μm.
-
H
The Cancer Genome Atlas (TCGA) RNA‐Seq analysis showing that ISLR is upregulated in human rectal adenocarcinoma relative to normal rectal tissues. The horizontal lines between the box limits represent the median, the box limits indicate the interquartile ranges, and the whiskers indicate limit superior and limit inferior, respectively; n = 65.
-
I
Kaplan–Meier survival curve of 270 CRC cases. P = 0.02 (log‐rank test).
-
J
ISLR level increased with nodal metastasis in colorectal cancer patients. N0, no regional lymph node metastasis; N1, metastases in 1–3 axillary lymph nodes; N2, metastases in 4–9 axillary lymph nodes; and N3, metastases in 10 or more axillary lymph nodes. The solid horizontal lines represent the median, the box limits indicate the interquartile ranges, and the whiskers indicate limit superior and limit inferior, respectively.
-
K, L
In situ hybridization for ISLR/Islr with RNAscope probes in normal human colon, human malignant adenocarcinoma, metastatic adenocarcinoma (K), and mouse colon tumors from AOM–DSS model (L). t indicating tumor; a indicating adjacent tissues of tumor. Scale bar: 50 μm.
Data information: In (A and F), data are presented as mean ± SD. *
‐test).

