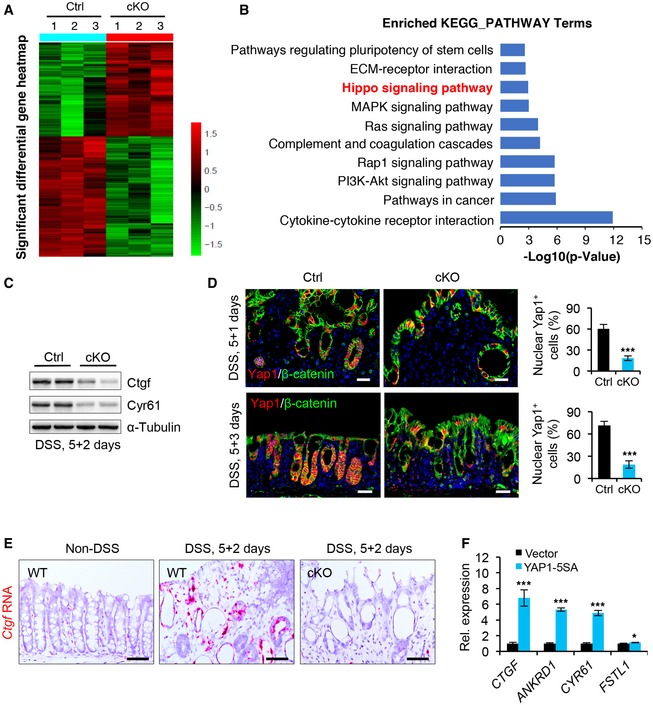
Heatmaps of differentially expressed genes (DEGs) in colons from control and cKO mice 1 day after DSS removal. Note: The cutoff is P < 0.05 and fold > 2. The parameter of the color key indicated the fold changes converted to log2 of signal value normalized.
KEGG pathway analysis of DEGs in cKO mice.
Western blotting for Ctgf and Cyr61 in colon tissues from control and cKO mice 2 days after 5‐day DSS treatment. α‐Tubulin was used as a loading control.
Double immunofluorescence for Yap1 and β‐catenin in the colons from control and cKO mice 1 or 3 days after 5‐day DSS treatment. Control, n ≥ 3 at each timepoint; cKO, n ≥ 3 at each timepoint. Scale bar: 50 μm.
RNAscope in situ hybridization assay for Ctgf in colonic epithelium from WT mice or control and cKO mice 2 days after 5‐day DSS treatment. Scale bar: 25 μm.
qRT–PCR analysis for CTGF, ANKRD1, CYR61, and FSTL1 in NCM460 colon epithelial cells transfected with vector or YAP1‐5SA. *P < 0.05; ***P < 0.001.
Data information: In (D and F), data are presented as mean ± SD. *
‐test).

